
Canadian Credit Remains Resilient as Tight Spreads Persist Amid Strong Demand
Robust issuance, strong energy sector performance, and elevated yields continue to support investor demand despite historically tight spreads.
Canadian corporate bond spreads remain near multi-year tights after largely recovering from the early-year volatility triggered by geopolitical tensions in the Middle East. The Bloomberg Canadian Aggregate Corporate OAS began 2026 at 84 basis points and widened to 95 basis points in late March before retracing most of the move, tightening back to roughly 85 basis points as of May 20, 2026.
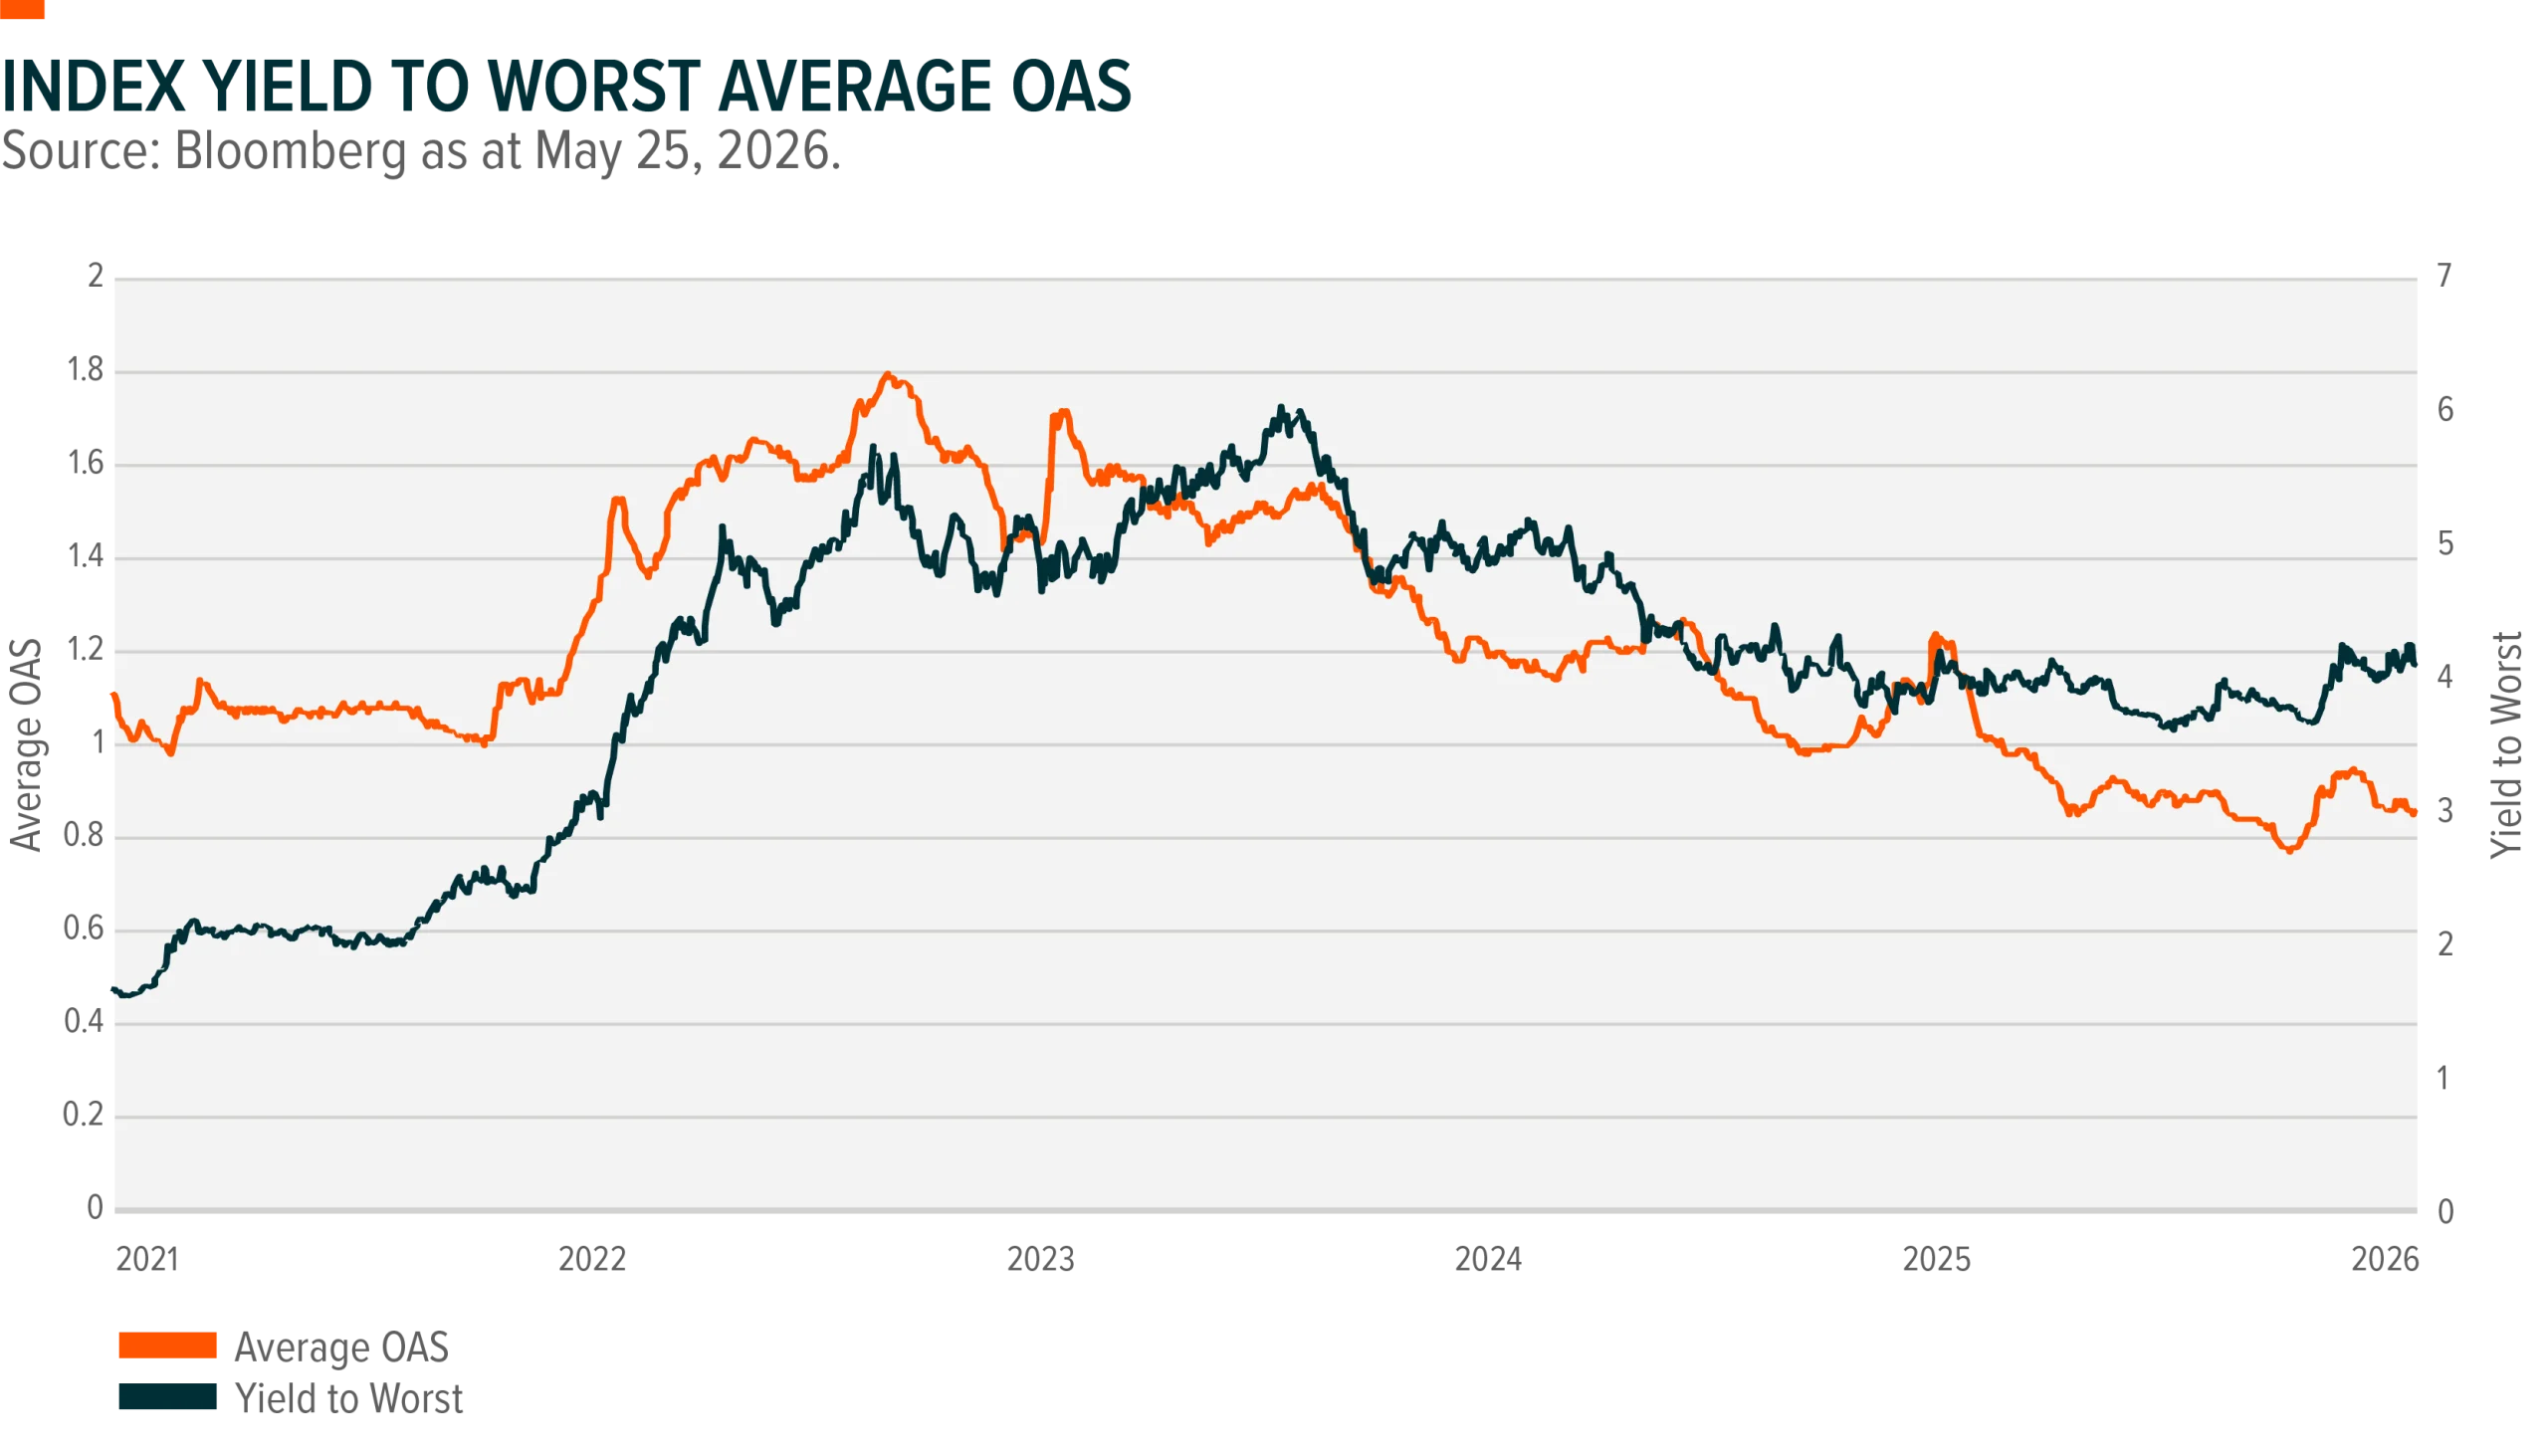
While spreads at these levels historically imply limited room for further compression, the rise in underlying government bond yields has kept all-in corporate bond yields elevated relative to recent years. This higher-income environment has continued to draw investor demand into the asset class, a dynamic that could persist provided economic growth remains resilient and recession risks stay contained.
Within the Canadian credit market, energy issuers have been among the strongest performers year to date (Source TD Securities, Bloomberg). Rising crude oil prices have supported sector fundamentals and attracted investors seeking exposure to companies perceived as beneficiaries of higher commodity prices. However, the market continues to debate the threshold at which elevated oil prices may begin to dampen economic activity and erode the broader benefits typically associated with Canada’s position as a net energy exporter.
Primary market activity has also been exceptionally strong. Canadian corporate bond issuance is running approximately 96% above year-to-date 2025 levels as of May 8, driven largely by robust supply from financials and energy issuers. The strength of the Canadian market has even attracted large international borrowers. On May 5, Alphabet issued an inaugural four-tranche Maple bond totaling CAD 8.5 billion, marking the largest bond deal ever completed in the Canadian market and surpassing the previous record set by the Coastal GasLink Pipeline financing in 2024.
Looking ahead to the remainder of 2026, current market conditions continue to support a preference for shorter-duration exposure. Shorter duration corporate bonds offer more favorable breakeven profiles and may provide greater resilience should spreads widen from current tight levels. In contrast, longer duration credit offers limited downside protection given current valuations.
Key Takeaways
• Canadian credit spreads have retraced most of the early year widening and remain near multi year tights.
• Higher all in yields continue to support investor demand despite limited spread compression potential.
• Energy credit has outperformed year to date as rising oil prices bolster sector fundamentals.
• Primary market issuance has surged, with supply nearly doubling versus the same period in 2025.
• Shorter duration credit remains more attractive given tighter spreads and limited long end protection.

Energy Markets and Volatility: Three Phases of the 2026 Oil Shock
A geopolitical supply shock in the Middle East sent oil prices and volatility sharply higher in early 2026, creating distinct market phases that reshaped energy markets and created conditions that may influence for options‑based strategies.
Global energy markets experienced one of the most volatile periods in recent history during the first half of 2026. The year unfolded in three distinct phases as geopolitical tensions escalated into a supply shock and eventually transitioned into a volatile consolidation period.
Phase 1: Pre‑Conflict Tensions
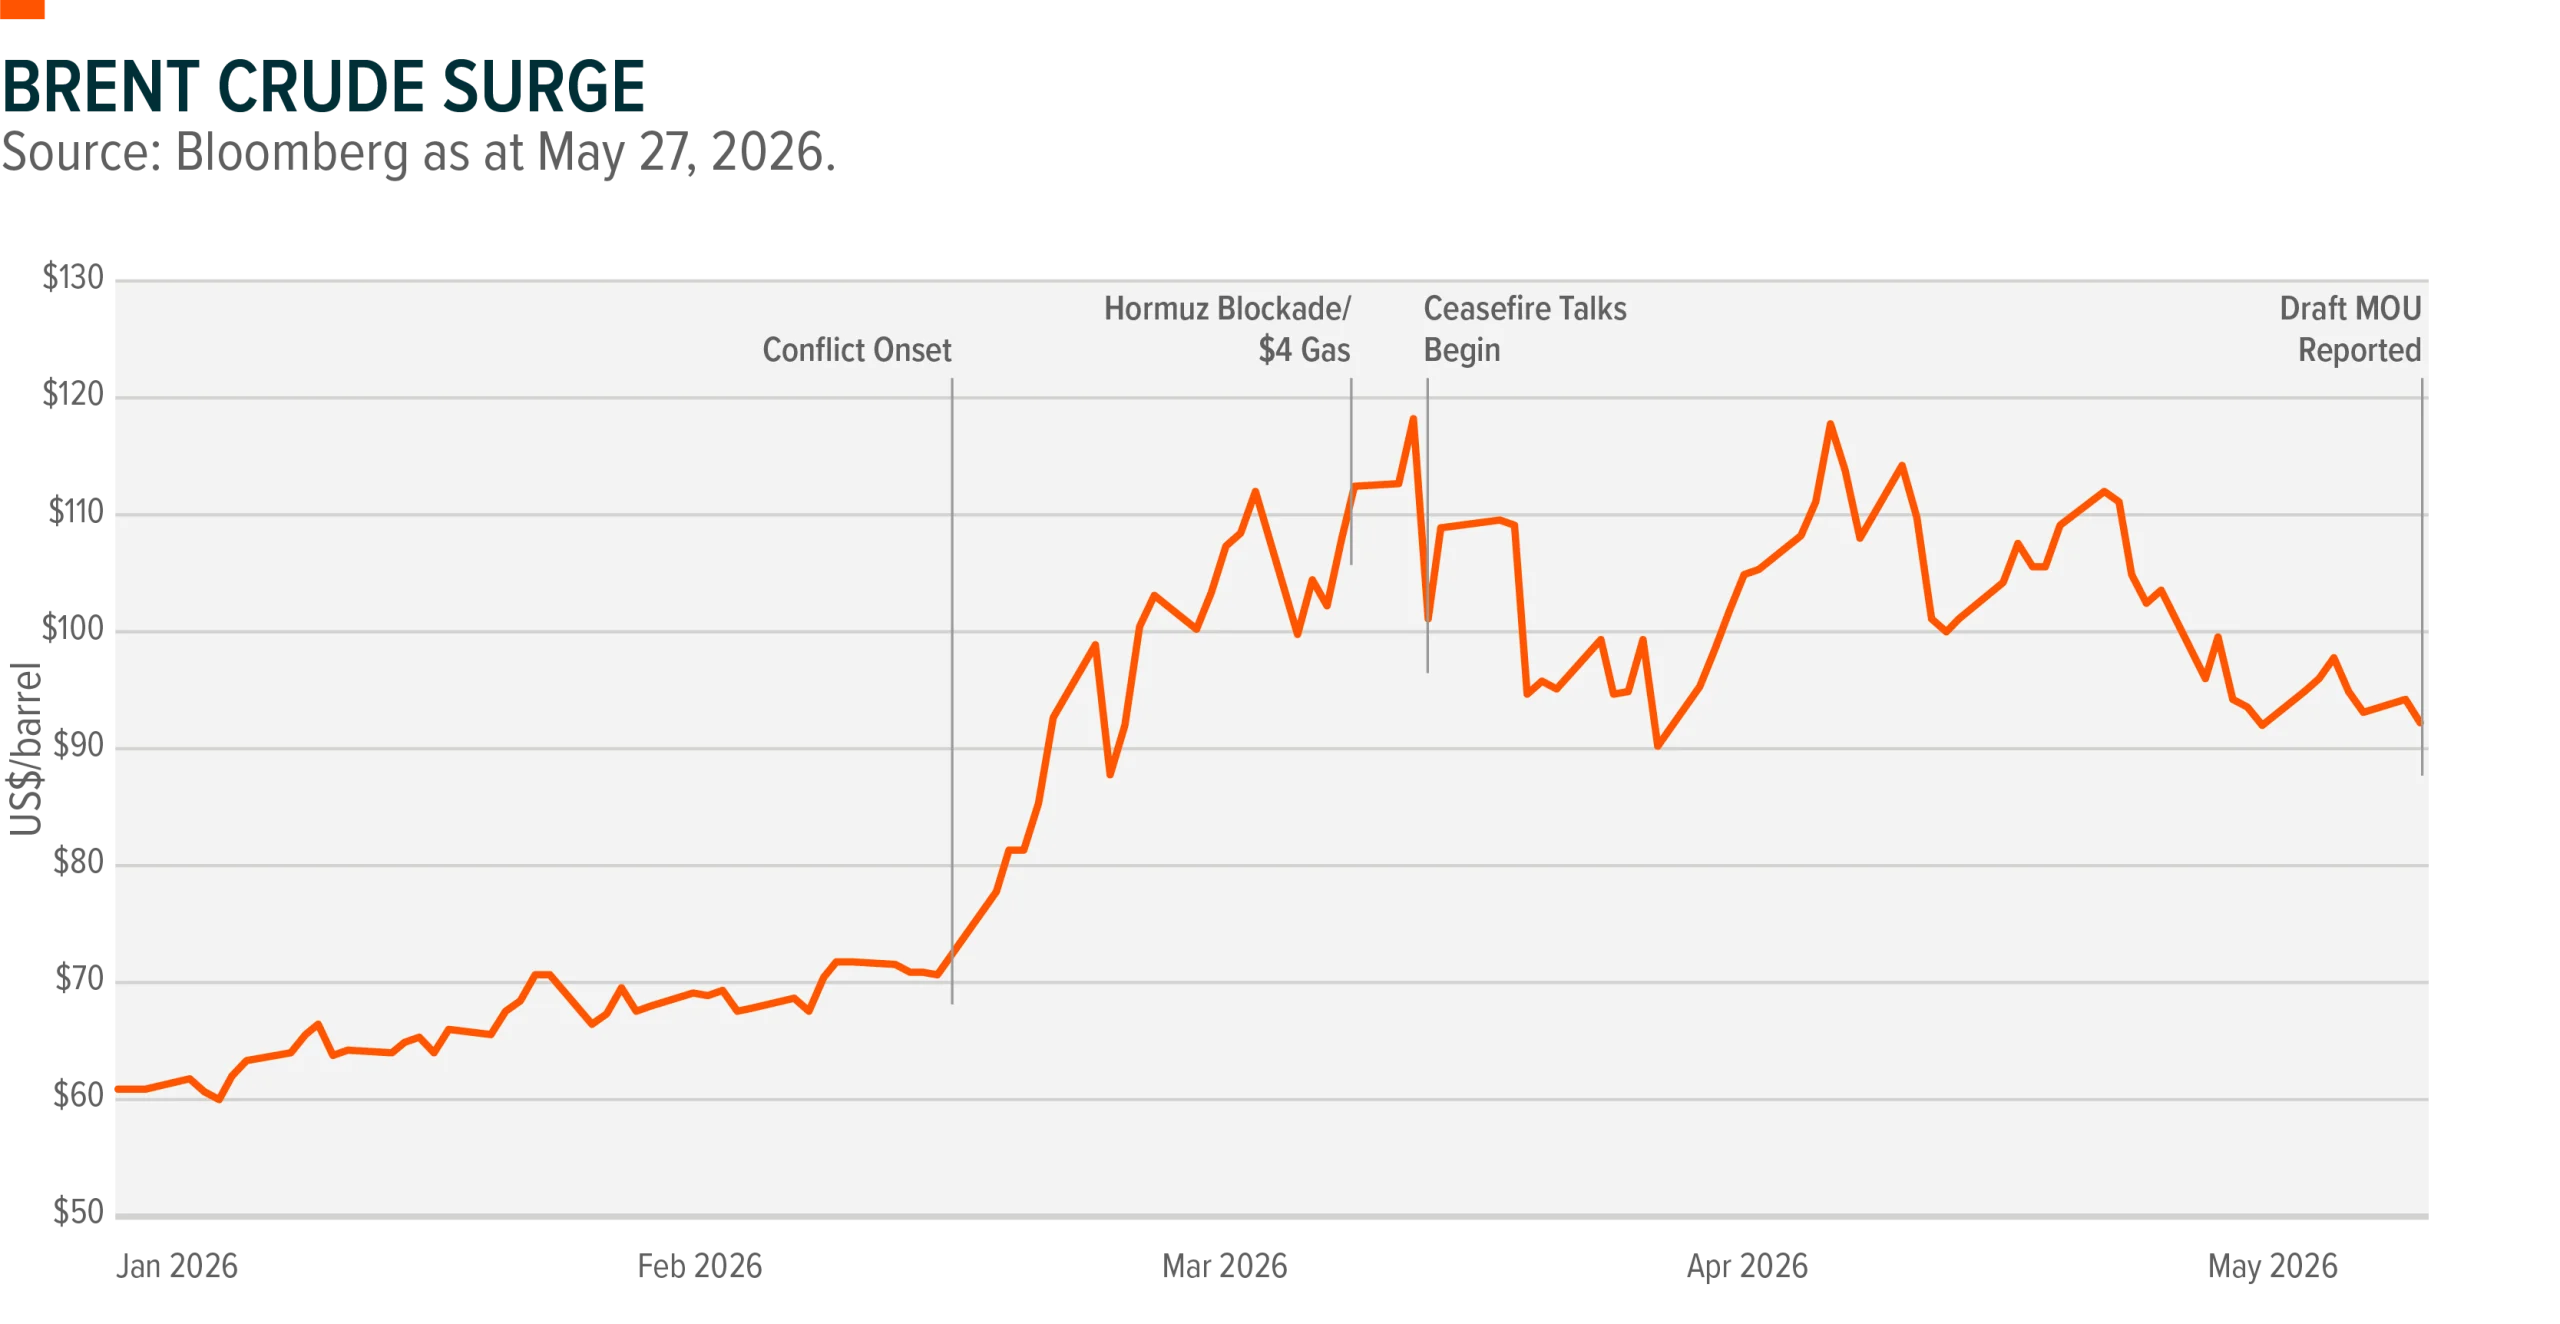
Brent crude began 2026 near $61 per barrel and traded within a relatively contained $60 to $72 range through February. While price action appeared stable on the surface, volatility was already building. The CBOE Crude Oil Volatility Index (OVX) started the year around 28 to 30 but climbed into the mid‑50s by late January as geopolitical tensions in the Middle East intensified. (Source: Bloomberg)
Phase 2: Conflict Onset and the Hormuz Closure
Market conditions changed dramatically in late February and early March when the U.S.–Israel military campaign against Iran began. Iran responded by effectively closing the Strait of Hormuz, a critical shipping route through which roughly 20% of global oil supply typically transits.
Oil markets rapidly repriced supply risk. Brent crude surged from approximately $72 per barrel on February 27 to a peak of $118 by early March. At the same time, volatility spiked sharply, with OVX jumping from roughly 65 to a peak near 121 in mid‑March—one of the most extreme oil volatility readings on record. The impact quickly spread to consumers, with U.S. gasoline prices rising above $4 per gallon for the first time since 2022 by the end of March.(Source: Bloomberg)
Phase 3: Volatile Consolidation and Ceasefire Attempts
By April, markets entered a new phase as ceasefire negotiations repeatedly stalled and restarted. Oil prices experienced sharp two‑way moves driven by geopolitical headlines, with Brent trading in a wide $90 to $118 range. While volatility moderated from its peak, OVX remained structurally elevated between roughly 75 and 95, still well above historical norms.
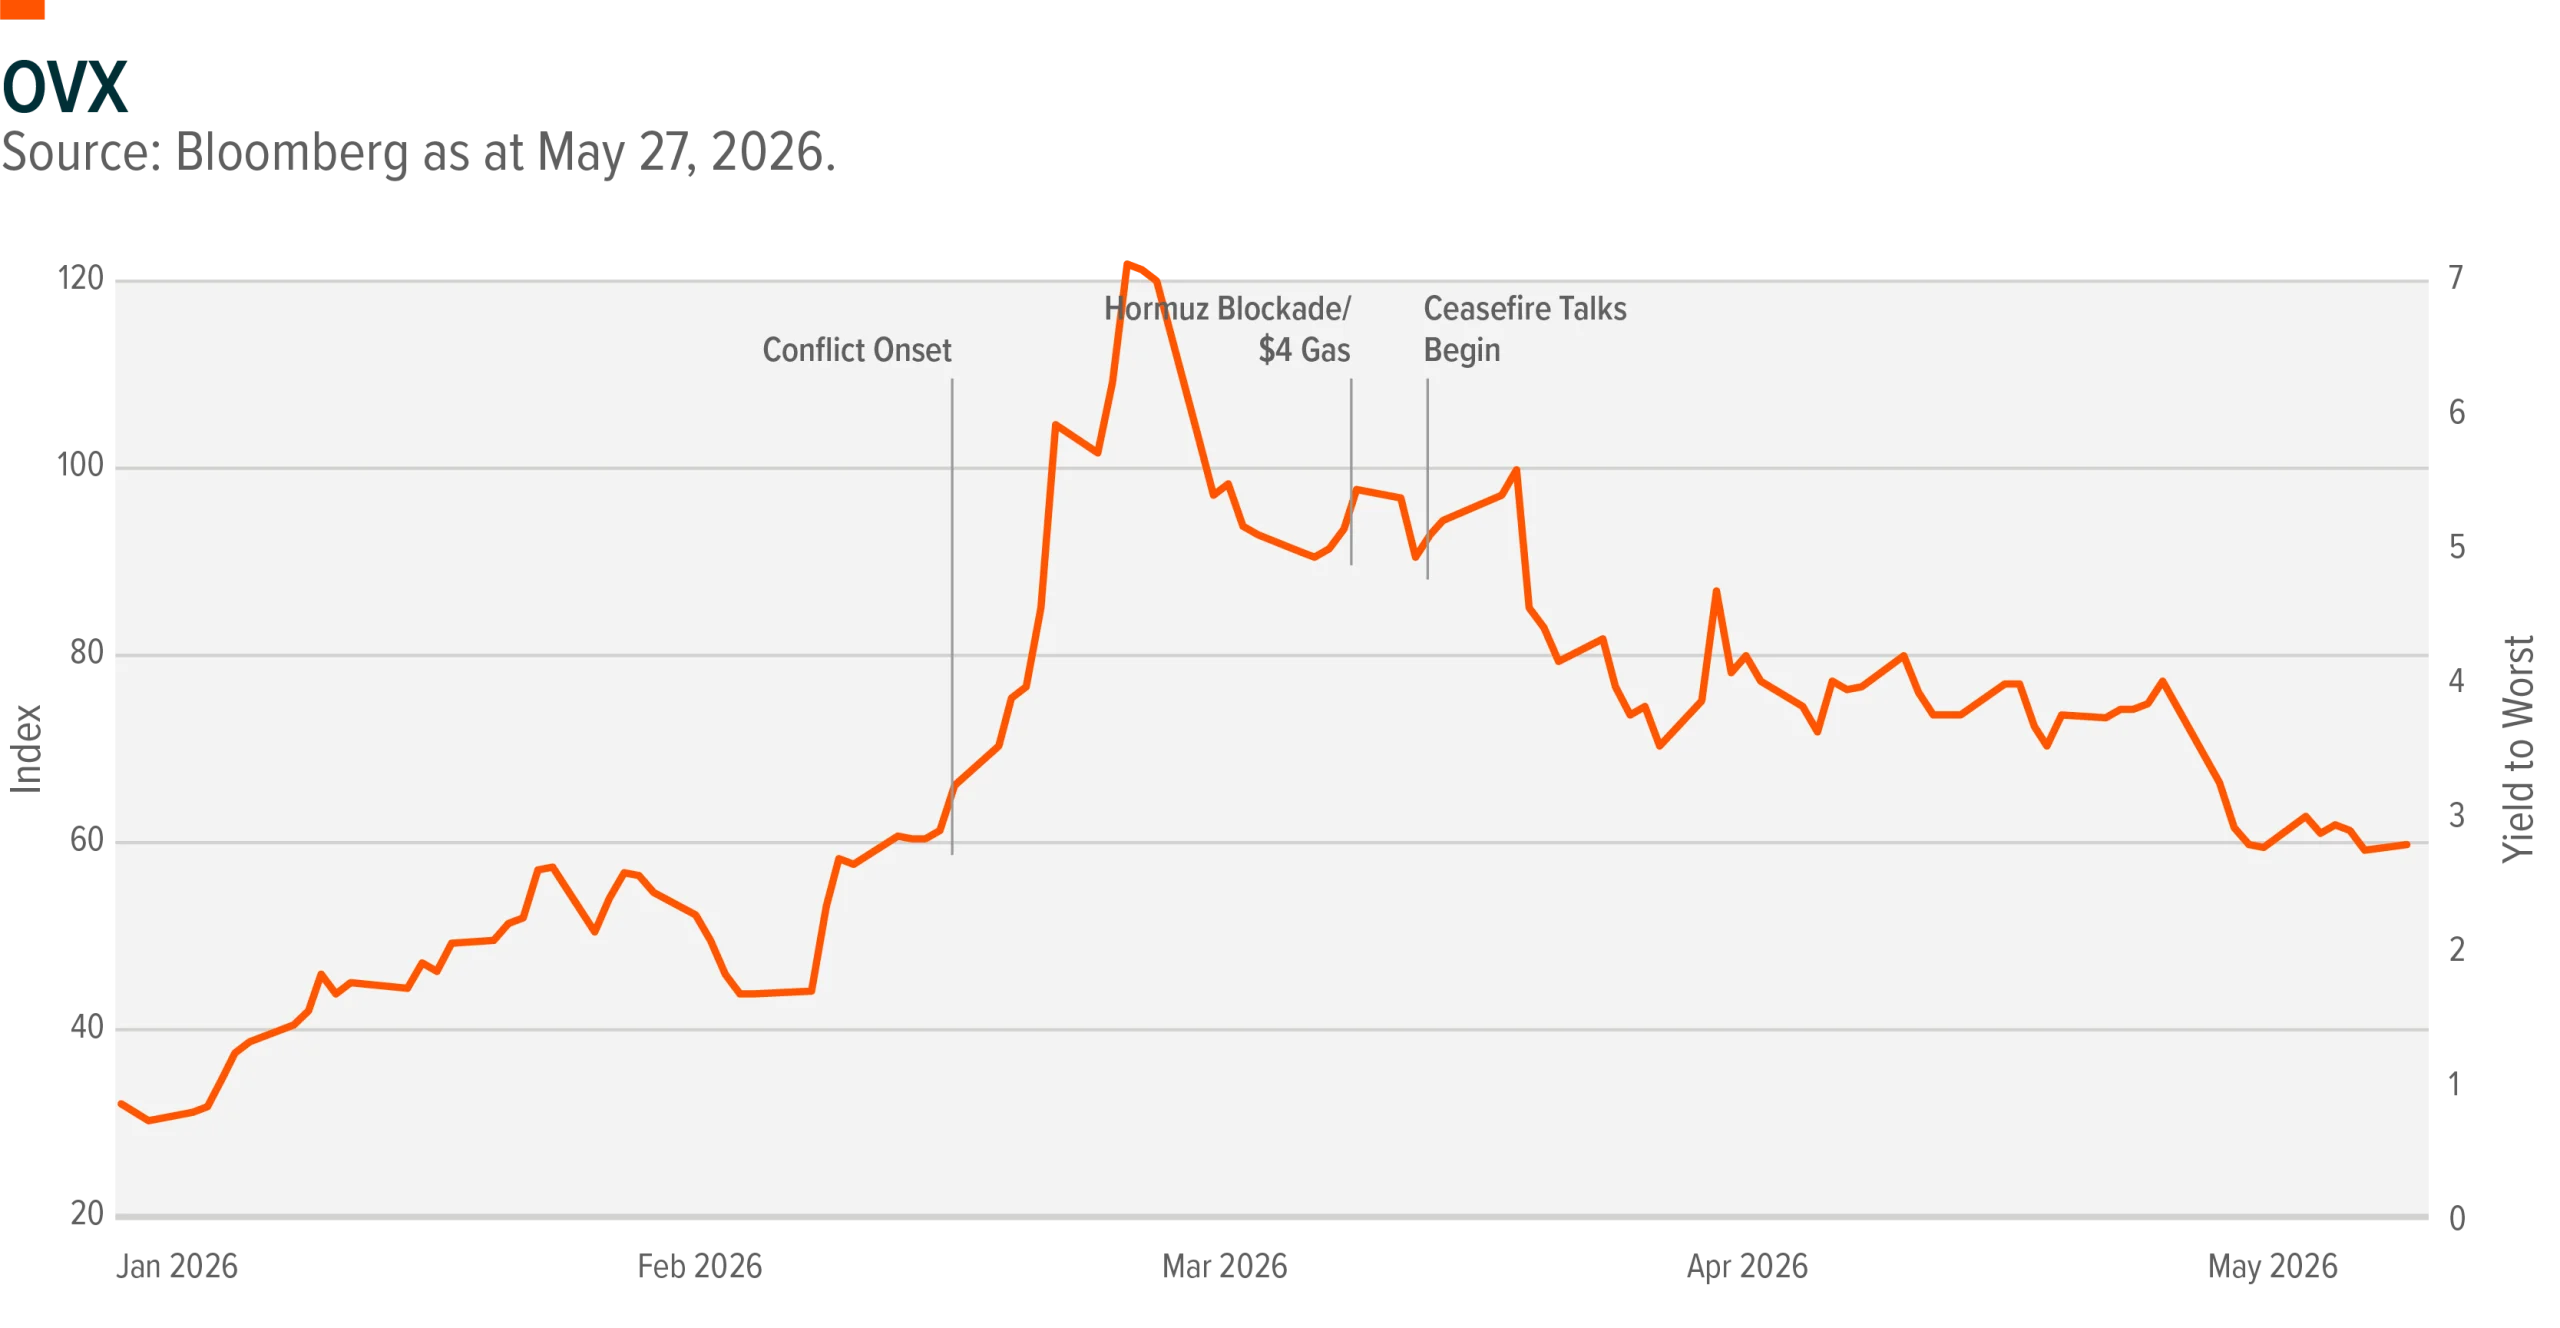
This environment proved particularly constructive for Global X’s Energy Covered Call ETF (ENCC). The surge in oil volatility, from roughly 28 at the start of the year to a peak near 121 and still around 65 at the time of writing, created two distinct premium‑harvesting opportunities for covered call strategies.
The first occurred during the initial supply shock. As volatility surged, portfolio managers were able to move call option strike prices further out‑of‑the‑money while still collecting comparable premiums. This allowed the strategy to maintain meaningful upside participation as energy equities rallied, with exploration and production companies outperforming energy transportation firms during this phase.
The second opportunity emerged during the consolidation period. As ceasefire negotiations progressed, implied volatility began to decline as some uncertainty was priced out of the market. At the same time, headline‑driven trading and shifting positioning created strong two‑way price movements, leading realized volatility to exceed implied volatility.
This combination of elevated option premiums alongside active two‑sided market moves may create a relatively supportive environment for certain covered call strategies. Premium generation remains above historical averages, while the back‑and‑forth price action allows managers to monetize volatility while reducing the likelihood of options being exercised.
Key Takeaways
• Energy markets moved through three distinct phases in the first half of 2026: pre‑conflict tensions, supply shock, and volatile consolidation.
• Brent crude surged from roughly $72 to $118 during the initial supply disruption.
• Oil volatility spiked to one of the highest levels on record during the conflict onset.
• Continued two‑way price action kept volatility elevated even as markets stabilized.
• Elevated volatility may have created favorable conditions for covered call strategies in the energy sector.

AI Commercialization and Digital Asset Regulation
Two Key Themes Shaping the Next Phase of Technology
Rapid advances in artificial intelligence and increasing regulatory clarity around digital assets are contributing in accelerating the commercialization of two of the most important technology trends in today’s market.
Artificial Intelligence: The Race to Commercialization
The past year has seen an explosion of activity around large language models, or LLMs, such as ChatGPT, Claude, Perplexity, Grok, and DeepSeek. These technologies are moving from experimental tools toward commercial platforms faster than previously anticipated by some market participants.
As LLM capabilities improve and adoption expands across industries, growth investors are increasingly focused on how to gain exposure to the companies building and enabling this technology. However, many of the leading developers remain privately held, making direct public market access limited.
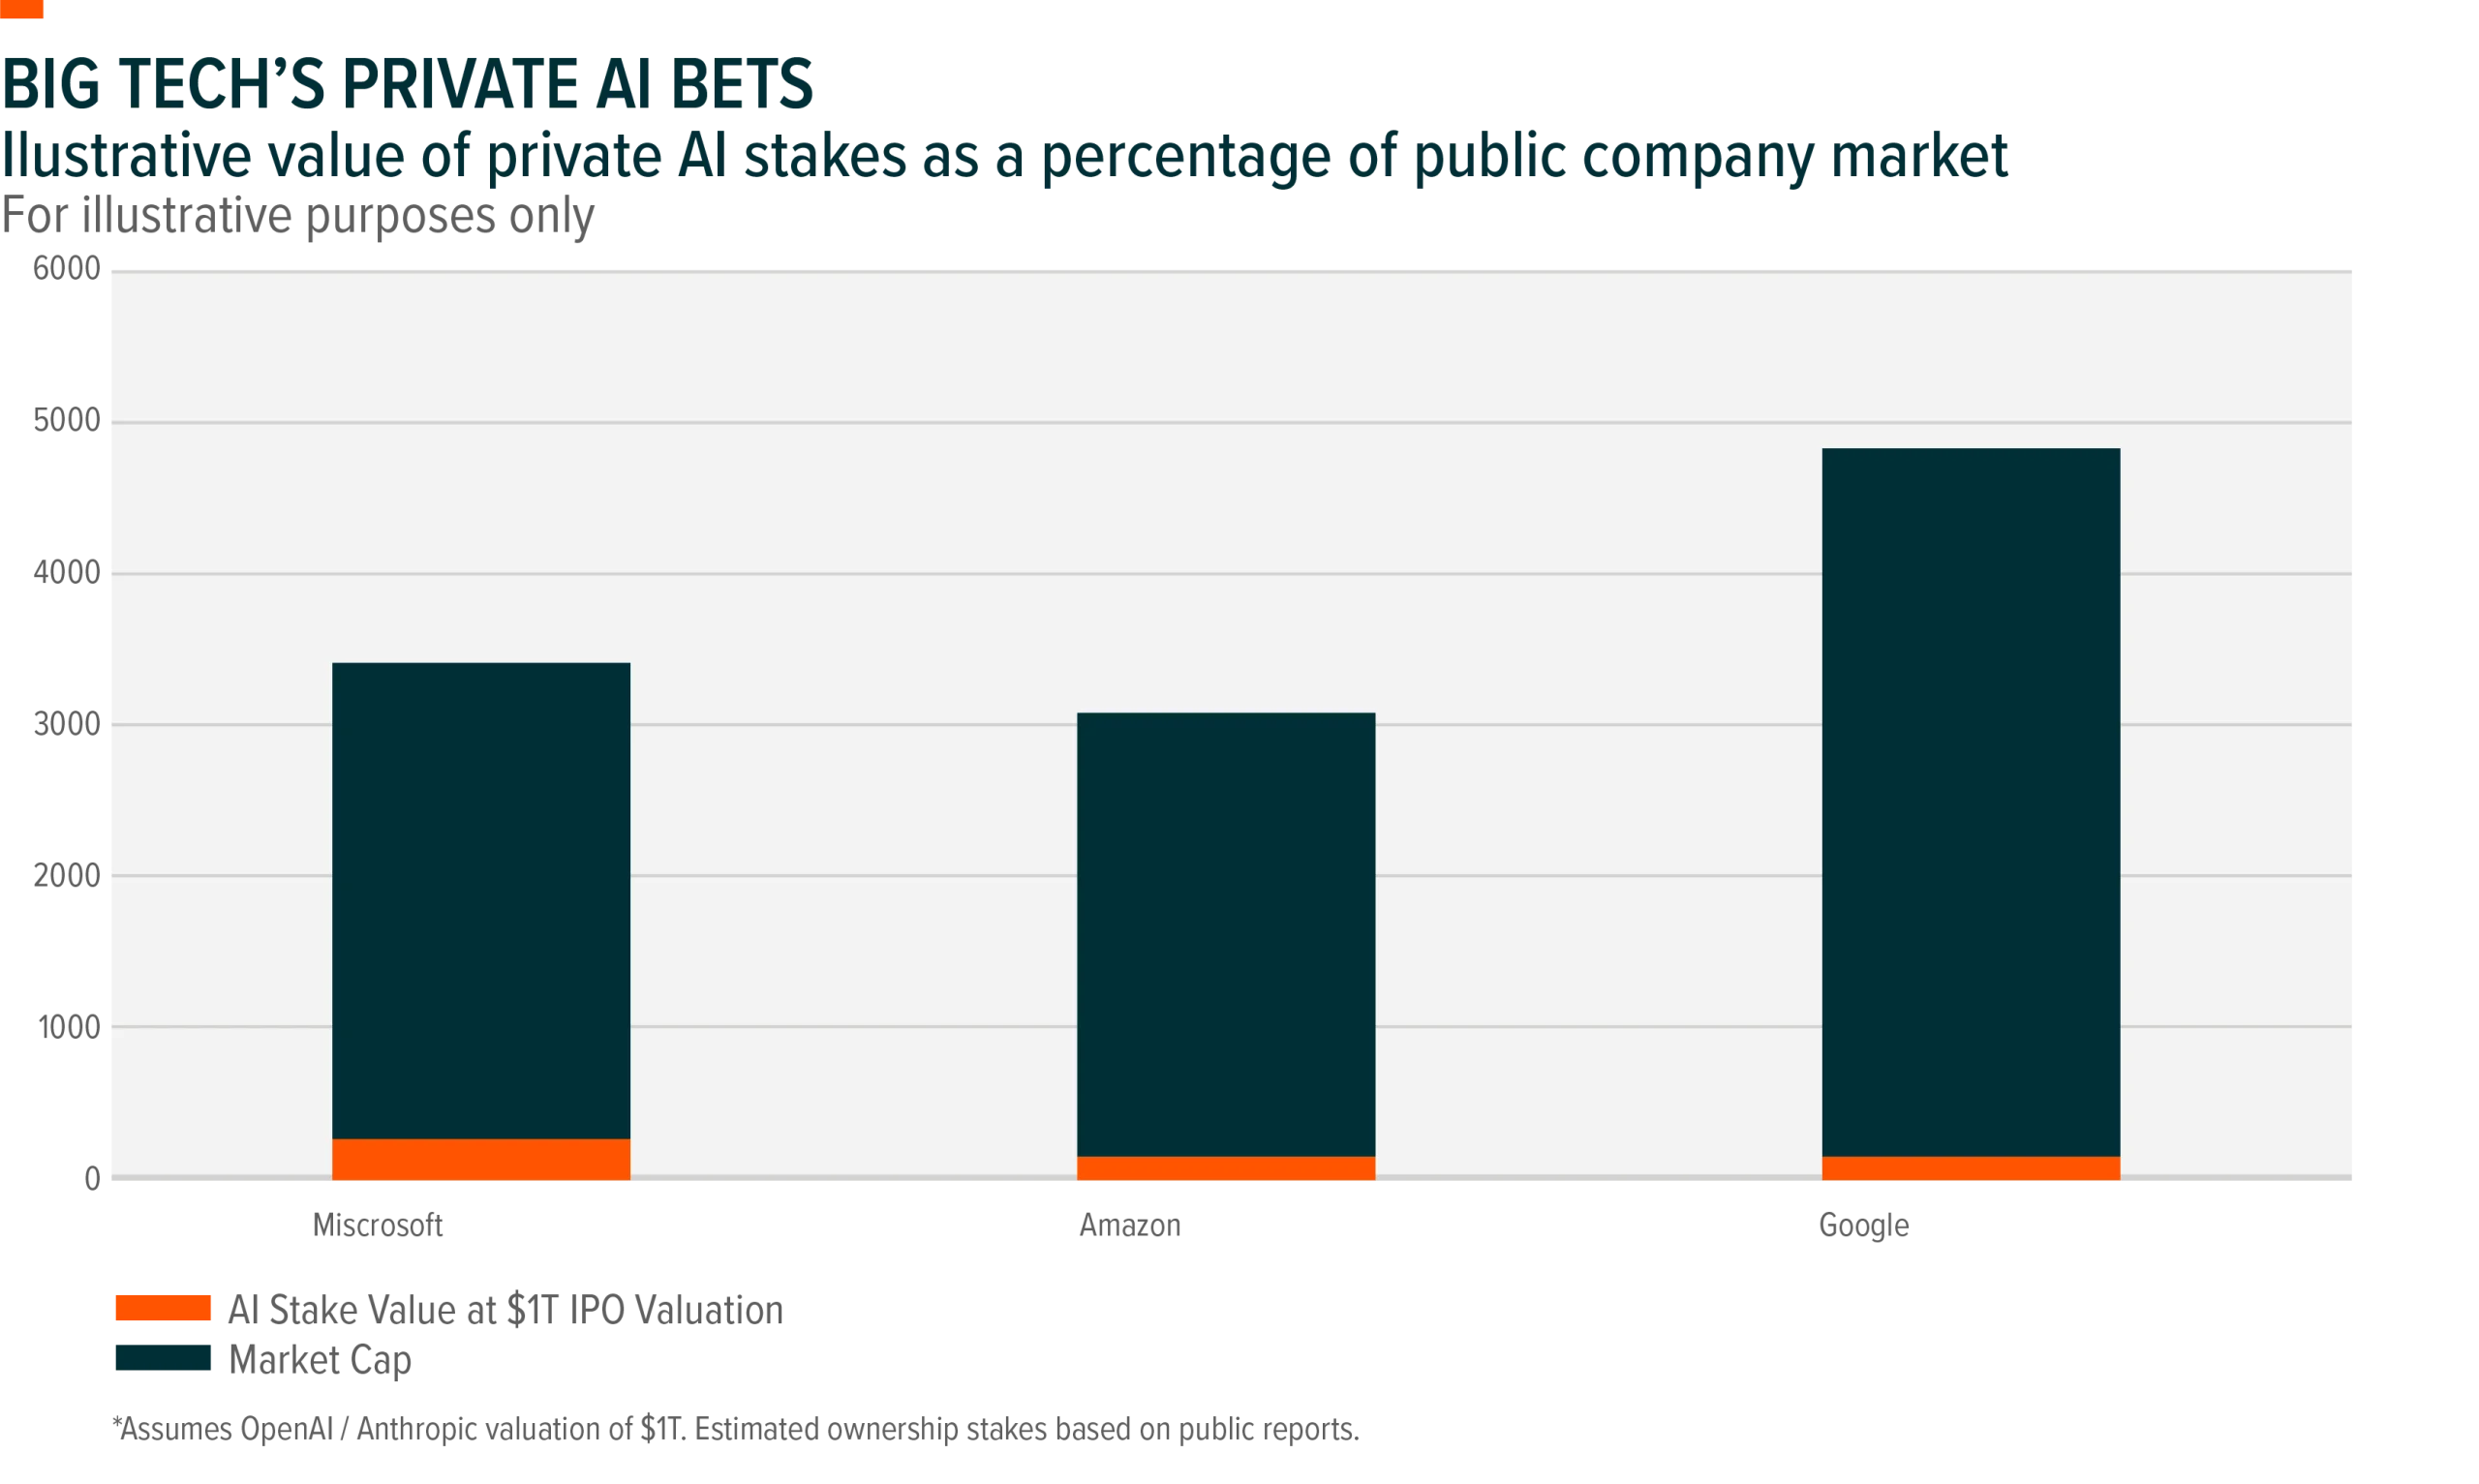
ChatGPT, developed by OpenAI, remains one of the most prominent examples. OpenAI is still privately held but has reportedly been exploring a potential initial public offering. Microsoft currently owns roughly 27% of OpenAI. Based on an implied valuation of approximately $500 billion for OpenAI, Microsoft’s stake would be worth roughly $135 billion, representing about 4% of Microsoft’s overall market capitalization. (Source: https://blogs.microsoft.com/blog/2025/10/28/the-next-chapter-of-the-microsoft-openai-partnership/)
Claude, developed by Anthropic, is another major competitor in the LLM space. Anthropic also remains private, with both Amazon and Google holding meaningful equity stakes. Assuming each company owns roughly 15%, their positions would imply a theoretical value of at approximately $50 billion based on Anthropic’s reported $350 billion valuation.(Source https://www.reuters.com/technology/blackstone-boosts-stake-ai-startup-anthropic-about-1-billion-source-says-2026-02-10/) That would represent roughly 1% of Google’s market capitalization and about 1.7% of Amazon’s.(Source https://www.reuters.com/business/google-plans-invest-up-40-billion-anthropic-bloomberg-news-reports-2026-04-24/https://www.nytimes.com/2025/03/11/technology/google-investment-anthropic.html/)
Several other emerging players remain largely inaccessible through public markets. Perplexity AI, which focuses on AI-powered search and answer engines, has reportedly been raising capital at valuations around $18 billion but currently has no clear publicly traded ownership proxy.
Similarly, Grok is developed by xAI, a company linked to SpaceX. While a potential SpaceX IPO could eventually offer indirect exposure, the connection to xAI may be diluted by SpaceX’s broader businesses, including launch services, satellite infrastructure, and Starlink.
DeepSeek, another rapidly growing AI developer, remains privately owned by High-Flyer Capital Management and is reportedly seeking funding at valuations above $20 billion.(Source: https://www.reuters.com/world/asia-pacific/tencent-alibaba-talks-invest-deepseek-information-reports-2026-04-22/) While companies such as Alibaba and Tencent have reportedly explored potential investments, no confirmed public market exposure currently exists.
Digital Assets: Regulation and Institutional Adoption
At the same time, the digital asset ecosystem is entering a new phase as regulatory frameworks are continuing to evolve for institutional participants.
Stablecoin adoption has accelerated since the GENIUS Act established a regulatory framework for stablecoins in July 2025. Financial institutions have increasingly integrated stablecoins and blockchain‑based settlement infrastructure into their operations.
JPMorgan’s Kinexys blockchain platform has seen daily transaction volumes grow from roughly $1 billion in 2025 to more than $5 billion in 2026. Meanwhile, Visa has expanded its use of USDC as a settlement mechanism, with transaction activity increasing by roughly 30% in just two months following its rollout with U.S. banks.(Source: https://www.jpmorgan.com/payments/newsroom/kinexys-milestones-2026/)
Regulatory developments continue to shape the market’s next phase. In May 2026, the Senate Banking Committee advanced the CLARITY Act, a proposed framework designed to define the regulatory structure for digital assets in the United States.
One of the central goals of the legislation is to distinguish between digital commodities and digital asset securities. If a token is classified as a security, it would fall under the jurisdiction of the U.S. Securities and Exchange Commission. If it is classified as a digital commodity, it would instead be regulated by the Commodity Futures Trading Commission.
In general, assets regulated by the CFTC are expected to face lower compliance costs and fewer regulatory hurdles, which could encourage greater innovation and issuance across the digital asset ecosystem.
The legislation also addresses stablecoin yield structures. Similar to the GENIUS Act, the CLARITY Act would restrict passive yield distribution on stablecoins. While this may reduce their attractiveness as collateral assets for certain institutional investors, it could support increased use of tokenized money market funds or Treasury products.Digital asset markets remain highly volatile and subject to evolving regulatory and technological risks.
For investors seeking exposure to companies building the infrastructure behind tokenization and digital assets—including exchanges, payment platforms, and blockchain technology providers—the Global X Blockchain & Bitcoin Strategy ETF (TOKN) offers diversified exposure to the evolving ecosystem. There can be no assurance that companies associated with these themes will benefit from long-term adoption trends, technological developments, changing competitive dynamics, or evolving regulatory frameworks.
Key Takeaways
• Large language models are rapidly moving toward commercialization, but many leading developers remain privately held.
• Public market exposure to LLM development currently comes primarily through strategic investors such as Microsoft, Amazon, and Google.
• Stablecoin adoption has accelerated as regulatory frameworks begin to take shape.
• Proposed legislation such as the CLARITY Act may significantly shape the future structure of digital asset markets.
• Tokenization and digital asset infrastructure continue to expand as institutional participation increases.

Monetary Policy Uncertainty and Geopolitical Shifts Reshape the Macro Landscape
At the start of 2026, the outlook for monetary policy in Canada and the United States diverged in important ways. In Canada, markets entered the year expecting the Bank of Canada to remain cautious about easing and, in some cases, even contemplating the possibility of rate hikes. After a year‑long rate‑cutting cycle that saw the Bank lower overnight rates from 5.00% to 2.25%, many investors believed the central bank’s bias entering 2026 was for the next move to be higher.
In contrast, the narrative in the United States centered on a potential resumption of the rate‑cutting cycle. At the start of the year, futures markets were pricing in multiple rate cuts from the Federal Reserve over the course of 2026, with investors anticipating gradual easing as inflation cooled and economic growth slowed.
As the year has progressed, however, expectations have become less certain. The conflict involving Iran has had a significant impact on global oil supply, contributing to rising crude prices. Oil markets are highly sensitive to instability in the Middle East, and higher prices can quickly feed through to headline inflation through gasoline and transportation costs, while also raising costs across the broader economy.
For central banks, this creates a more complicated policy environment. Higher energy prices have slowed progress on inflation just as policymakers were preparing to ease policy. For investors, the key takeaway is that the interest‑rate outlook in both Canada and the United States has become less predictable than it appeared at the start of the year. Rather than a clear path toward lower rates, monetary policy will likely remain highly dependent on incoming inflation data, economic momentum, and geopolitical developments.
Another structural theme shaping the macro environment is the gradual shift away from globalization toward a more fragmented and strategically oriented economic order. Over the past several years, governments have increasingly prioritized economic security, resilient supply chains, and domestic production capacity. Trade tensions, geopolitical rivalries, and supply disruptions exposed during the pandemic have accelerated this shift.
As a result, many countries are now pursuing policies that encourage domestic investment in critical industries such as semiconductors, energy infrastructure, rare earth minerals, and advanced manufacturing.
This shift is also contributing to a notable increase in defence spending. Rising geopolitical tensions and a more uncertain global security environment have prompted many governments to reassess military readiness and strategic capabilities. Across North America, Europe, and Asia, defence budgets have been expanding as countries invest in modern equipment, cybersecurity, and advanced technologies.
While globalization is unlikely to fully reverse, current trend suggests a more regionalized and security‑focused economic framework. For investors, this shift could support sustained capital investment in defence, energy security, and strategic industrial sectors as governments increasingly prioritize national resilience alongside economic growth.
Key Takeaways
• Interest‑rate expectations in Canada and the U.S. have diverged but remain increasingly uncertain.
• Higher oil prices linked to geopolitical tensions are complicating the inflation outlook.
• Monetary policy is likely to remain highly data‑dependent rather than following a clear easing path.
• Governments are prioritizing economic security, supply chain resilience, and domestic production.
• Increased geopolitical tensions are supporting long‑term investment in defence and strategic industries.

Portfolio Strategy: Barbell Growth with Real Asset Exposure
Positioning for the Next Investment Cycle in Real Assets and Infrastructure
As the macro environment evolves, investors are increasingly looking for portfolio strategies that balance long‑term growth with assets that can perform in inflation‑sensitive environments. One approach is a barbell strategy that combines structural growth themes with real asset exposure, particularly commodity producers and infrastructure.
Commodities: Owning the Input Producers
Commodities are increasingly being viewed not only as an inflation hedge but also as a core portfolio allocation. Over the past two decades, commodities have exhibited near‑zero correlation with global bonds and relatively low correlation with U.S. equities, offering diversification benefits at a time when traditional stock‑bond relationships have become less reliable.
Today’s macro backdrop may further support real asset exposure. Global inflation is expected to edge higher in 2026 as energy markets react to supply disruptions linked to geopolitical tensions in the Middle East. Against this backdrop, global commodity prices are projected to rise by roughly 12–16% this year, driven primarily by energy and metals.
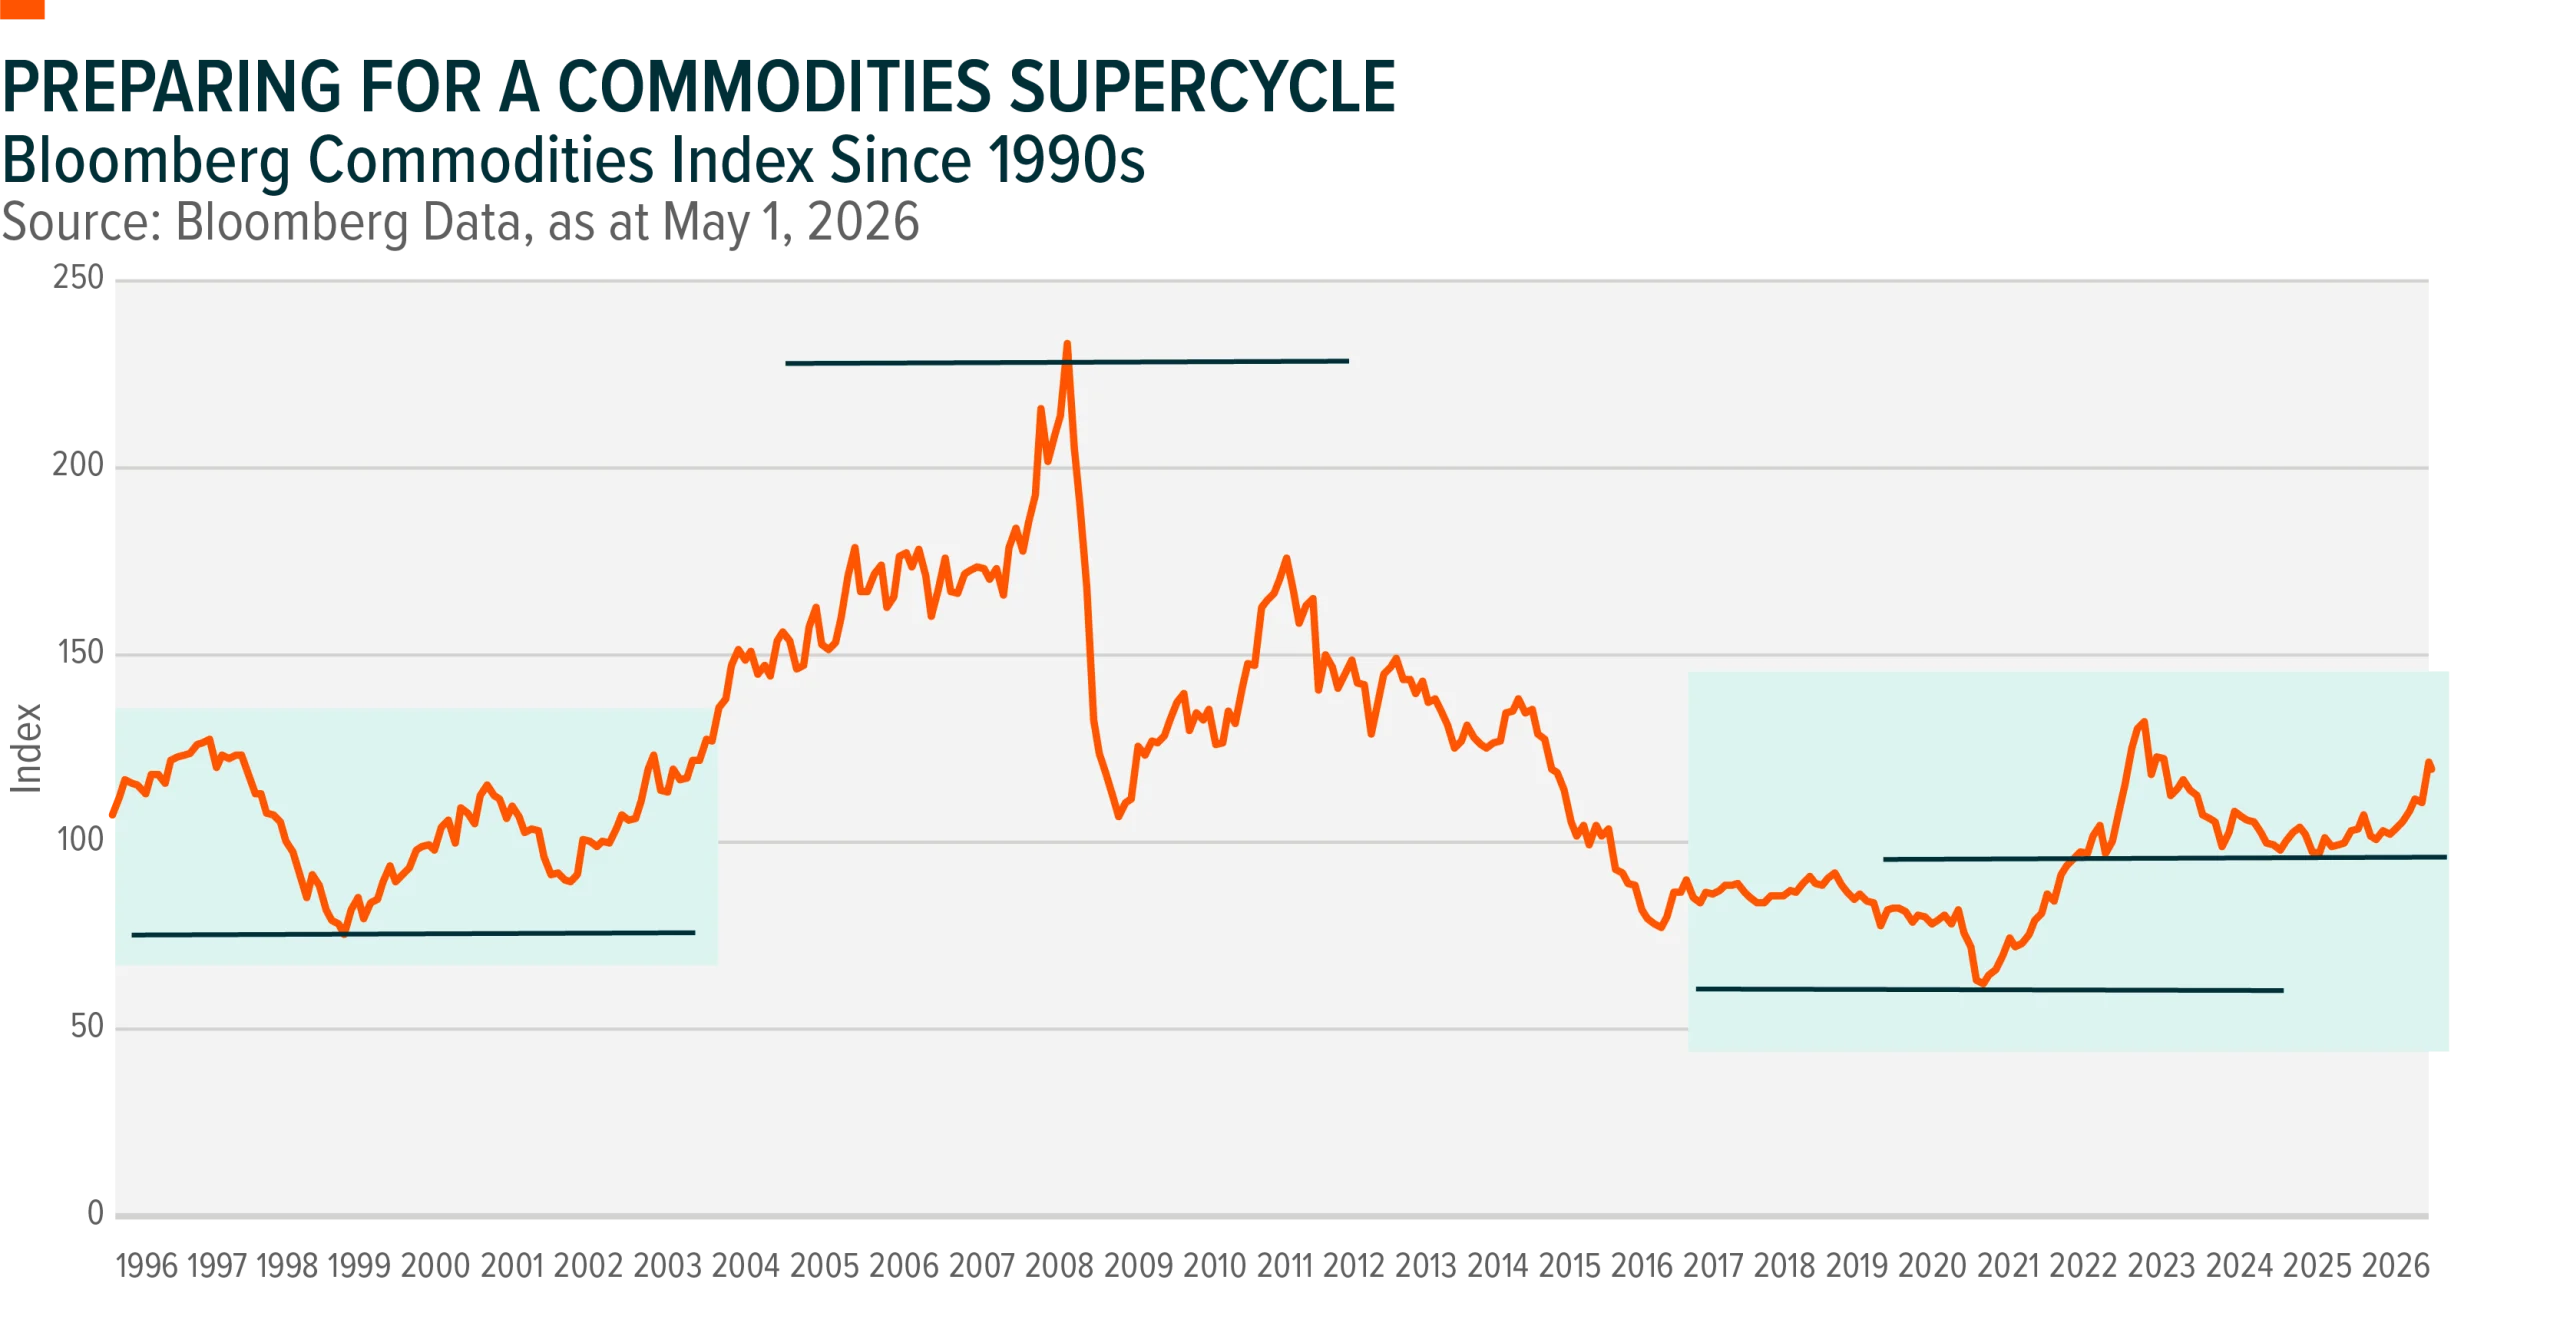
Commodity producers offer a particularly compelling way to participate in this environment. Mining and metals companies currently screen at roughly one standard deviation below their long‑term relative valuation averages despite improving fundamentals. Because producer revenues and earnings are directly tied to commodity prices, these companies often provide operating leverage when underlying commodity prices rise.
Despite a recent rally, many commodity producers remain under‑owned, and analyst estimates have yet to fully reflect the potential upside from stronger commodity markets. If commodity prices continue to surprise to the upside, earnings revisions could follow.
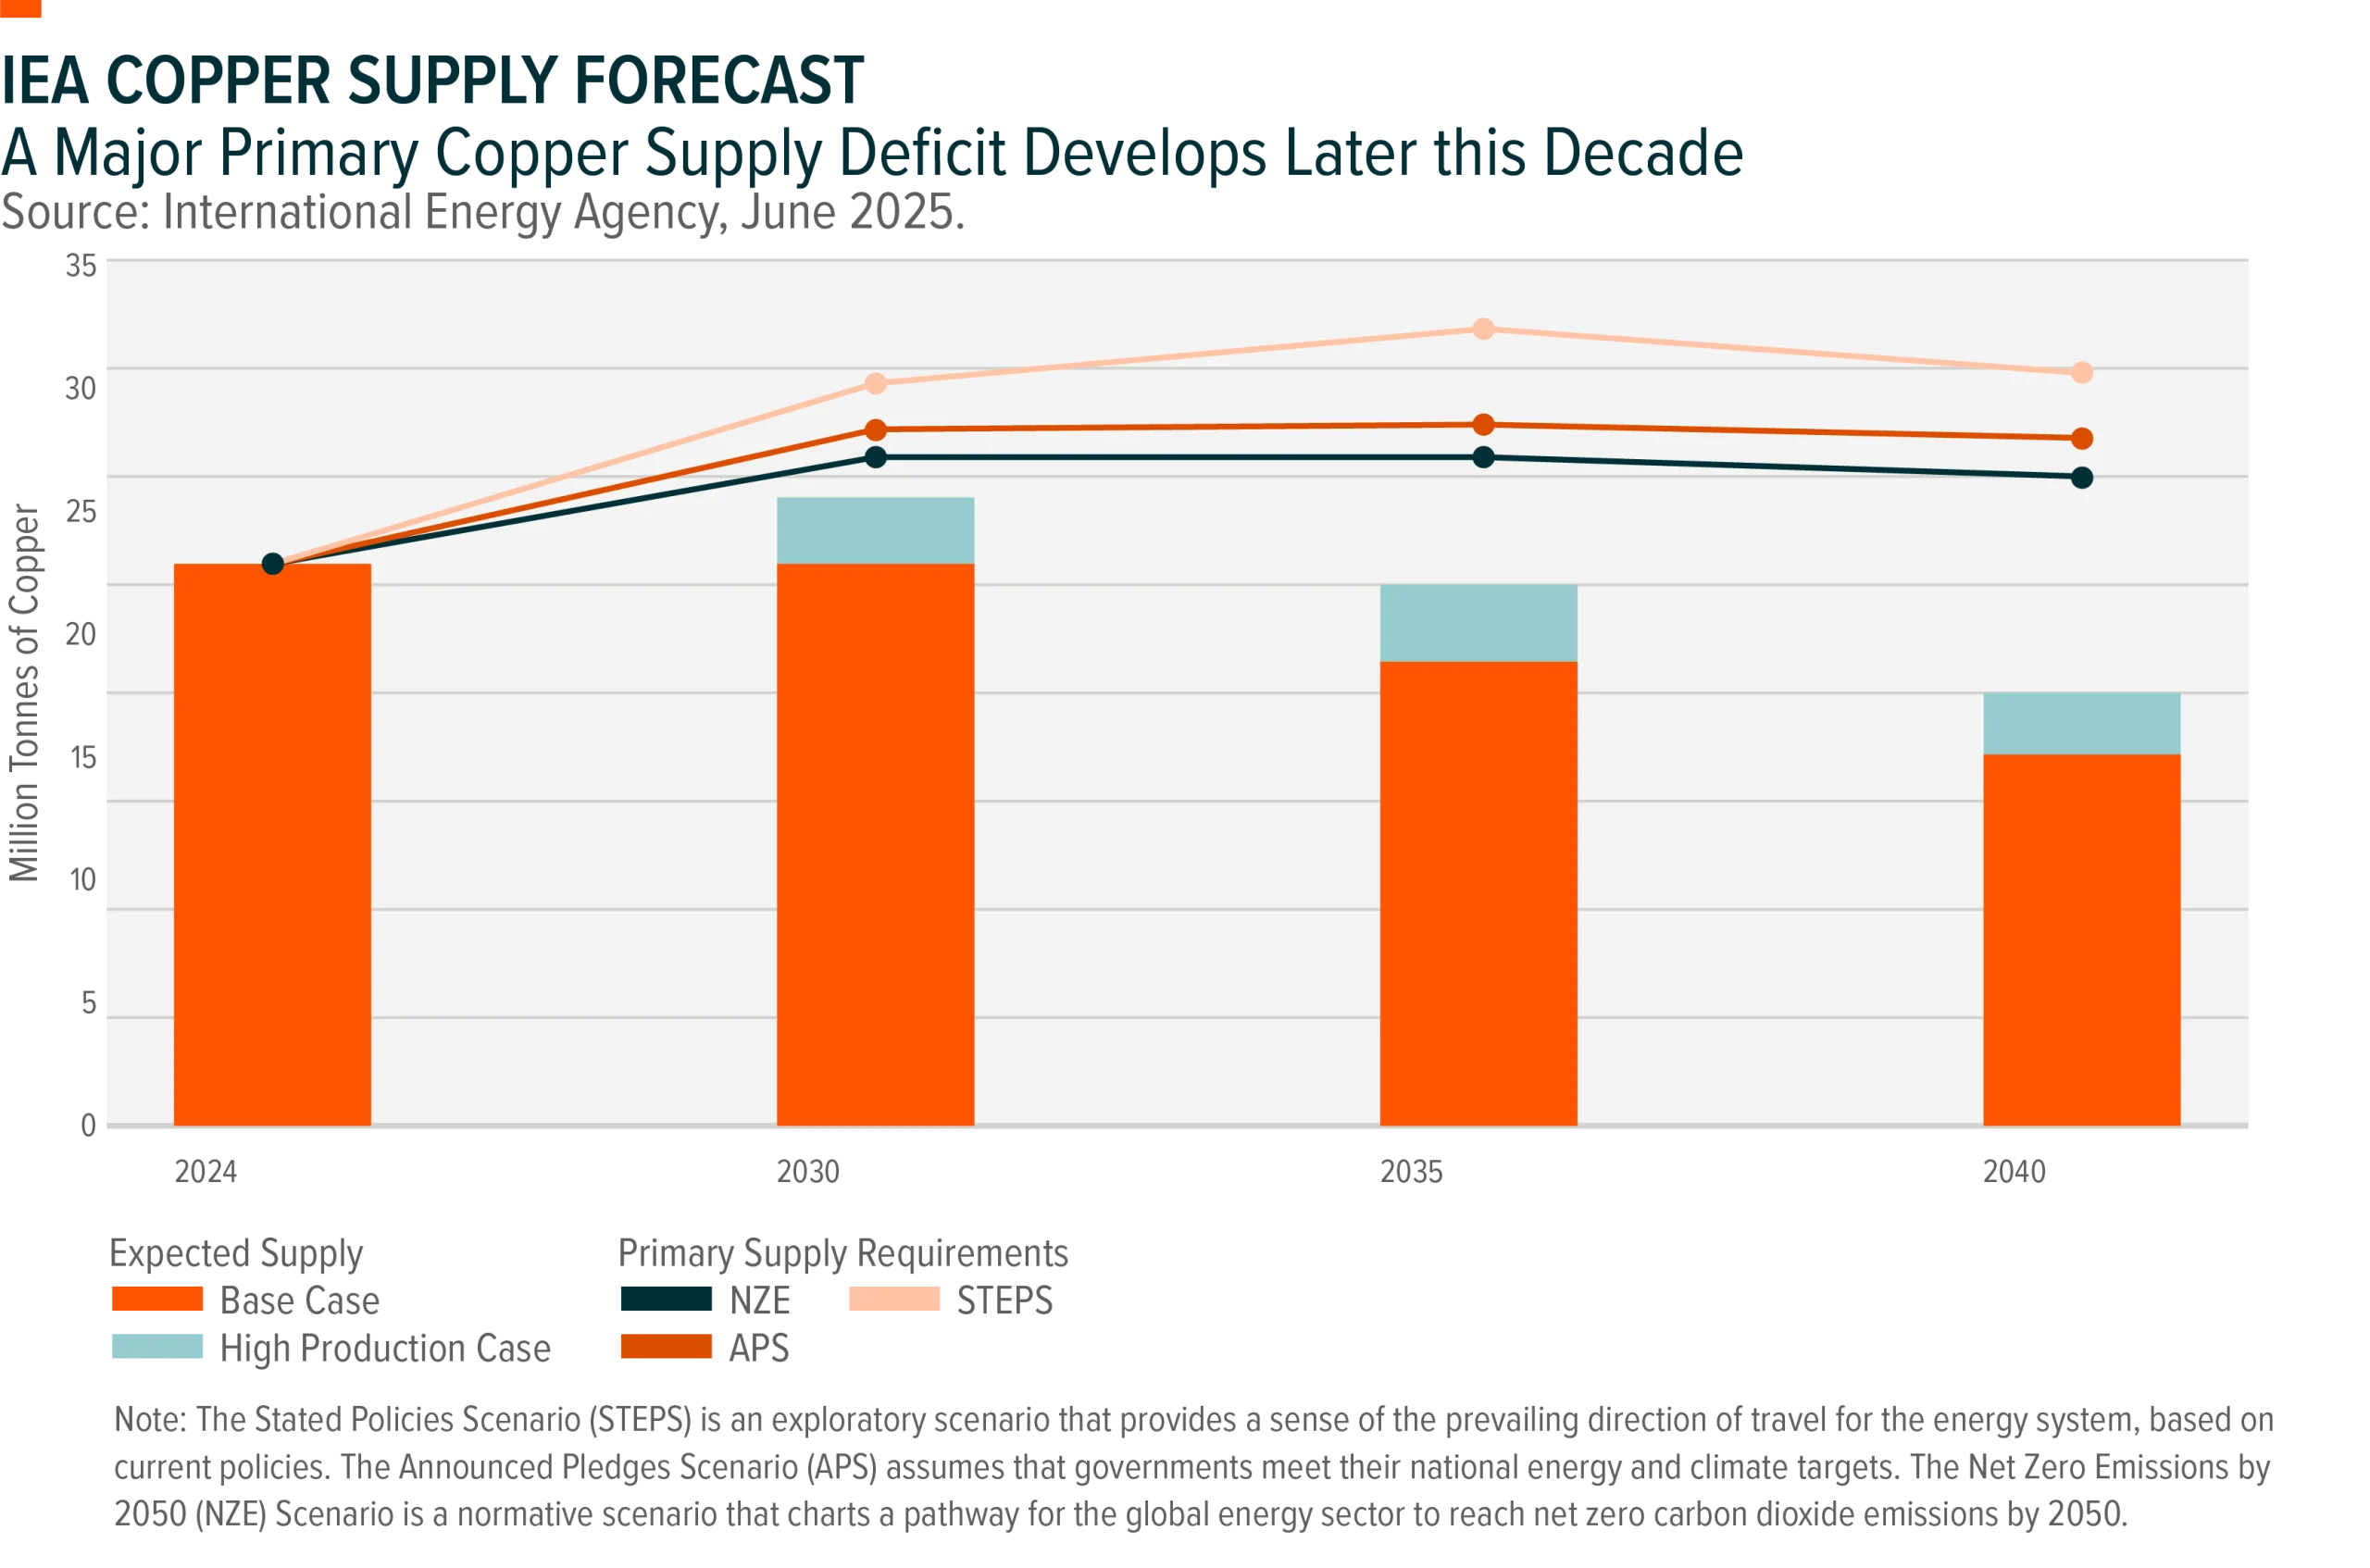
Several commodities also benefit from powerful structural demand trends. Silver demand continues to expand due to its use in electronics, solar panels, electric vehicles, and data center technologies. Uranium remains structurally constrained as global mined supply struggles to keep pace with demand from the expanding nuclear energy sector. Meanwhile, copper sits at the center of electrification and power grid expansion, with demand also rising alongside AI‑driven data center growth.
From a portfolio construction perspective, commodities can serve as a complement to traditional fixed income exposure for some investors. In periods when stocks and bonds move more closely together, real assets and commodity‑linked exposures may provide an alternative source of diversification and inflation protection.
Investors can access this theme through diversified commodity producer exposure, income‑focused strategies that overlay options, or higher‑income strategies that combine commodity exposure with enhanced yield generation.
Infrastructure: The Physical Backbone of Reindustrialization and AI
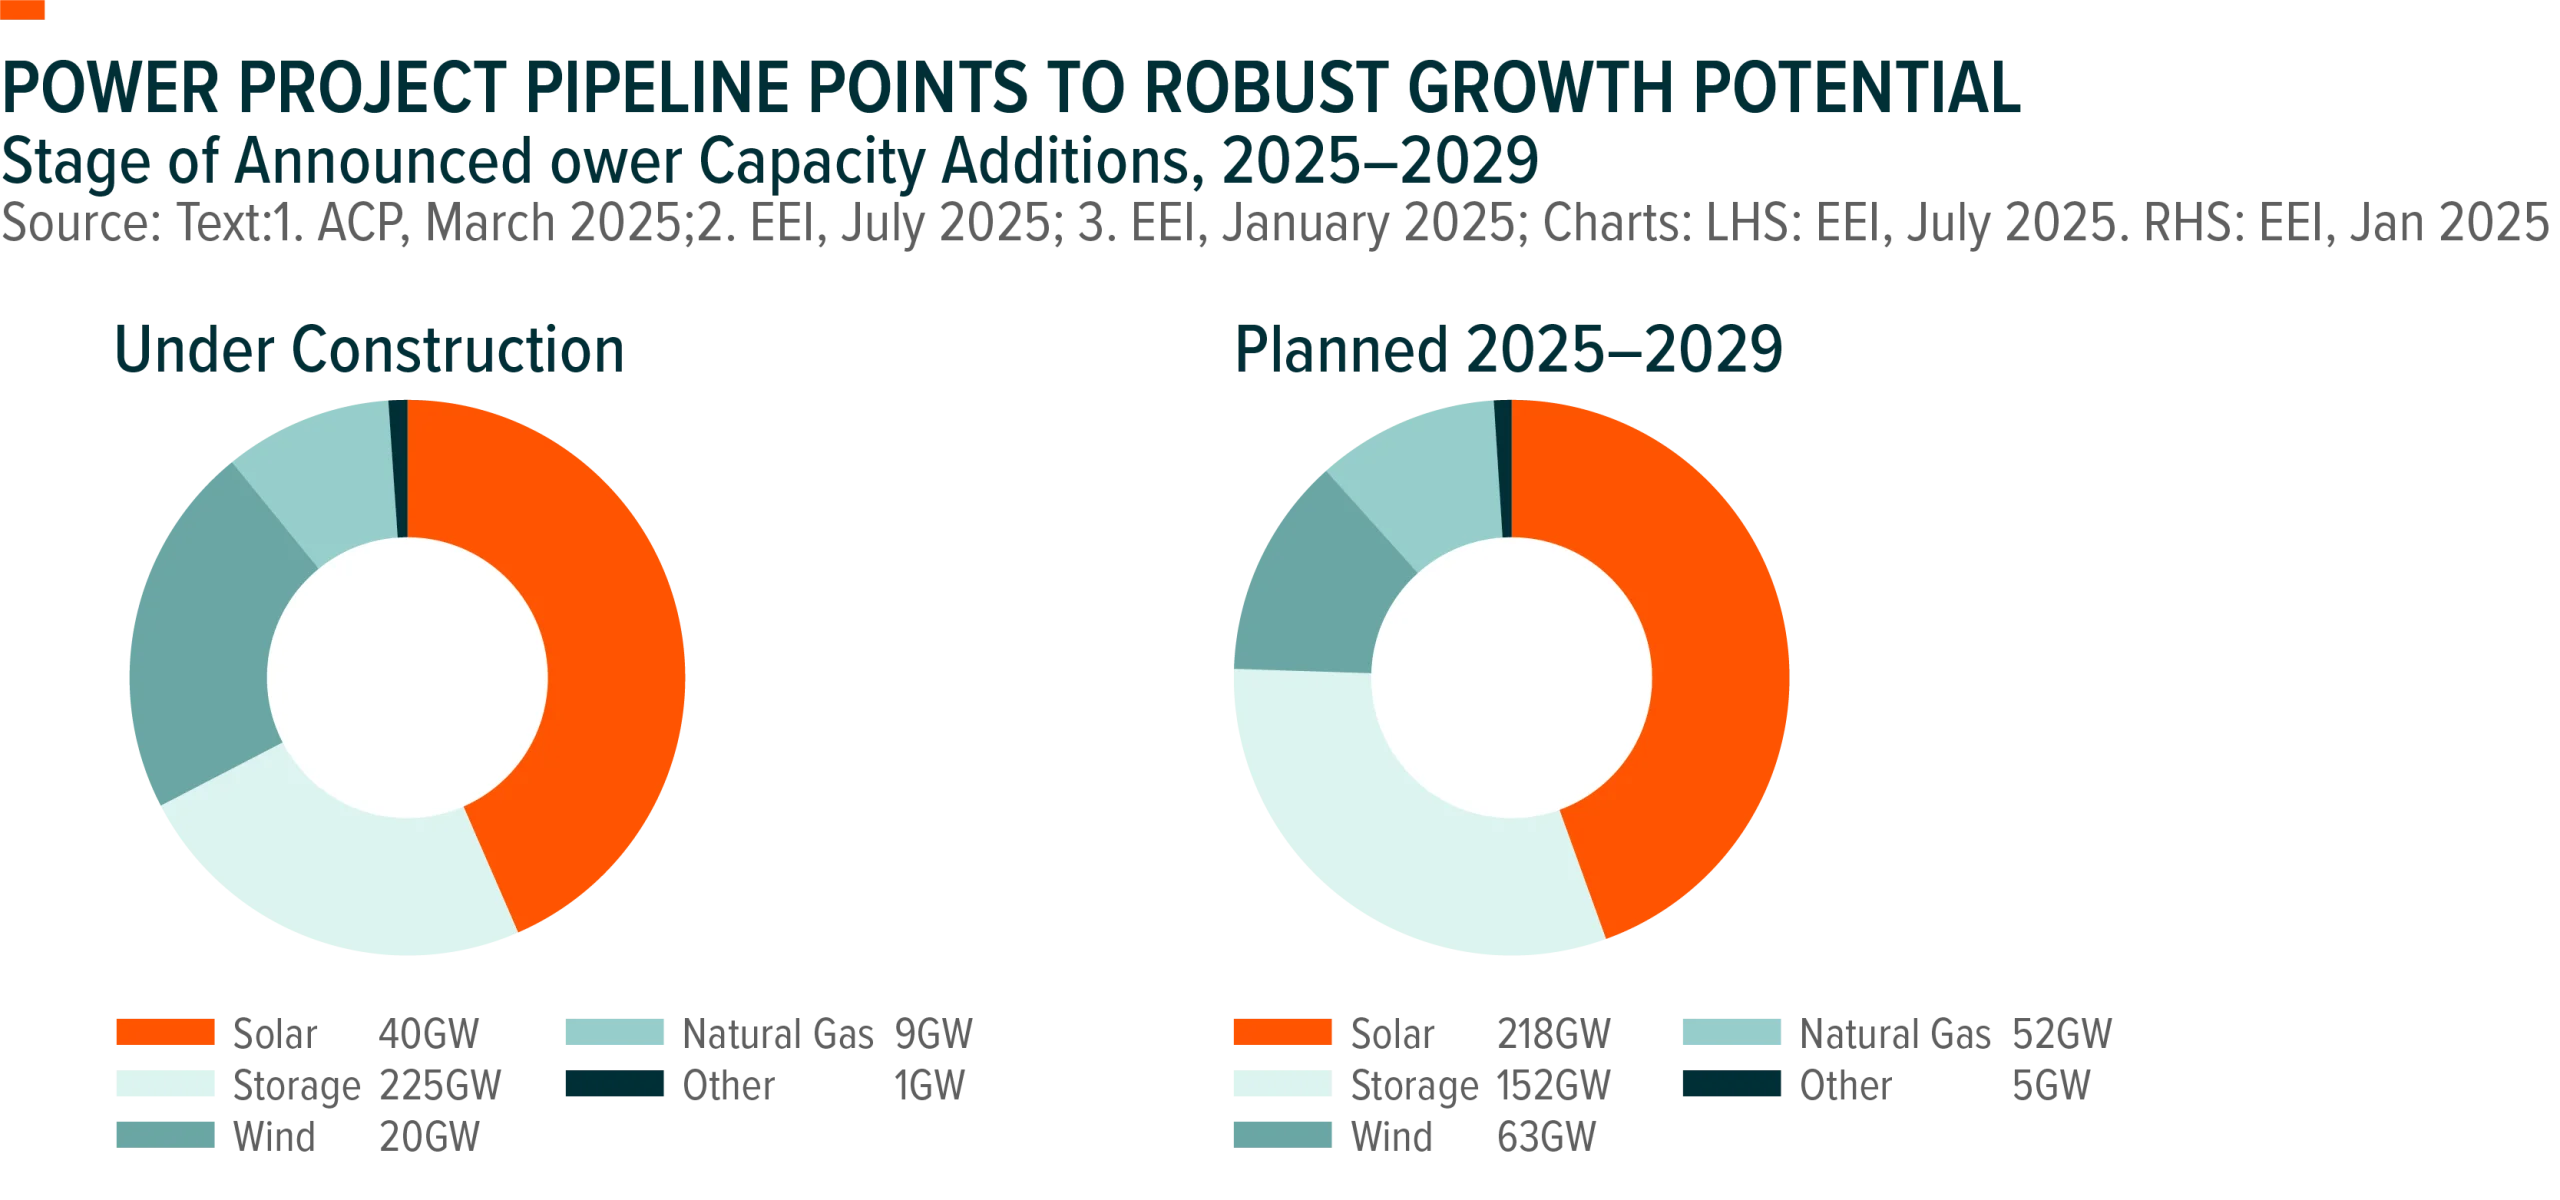
Alongside commodities, infrastructure represents another real asset theme gaining momentum. The global economy is entering a phase of large‑scale physical investment driven by electrification, artificial intelligence, and the reshoring of manufacturing.
The rapid growth of AI is increasingly becoming an infrastructure story. Data centers require enormous amounts of electricity, cooling capacity, and physical infrastructure. The International Energy Agency estimates that global data center electricity demand could rise from roughly 460 terawatt‑hours in 2024 to more than 1,000 terawatt‑hours by 2030, and approximately 1,300 terawatt‑hours by 2035.
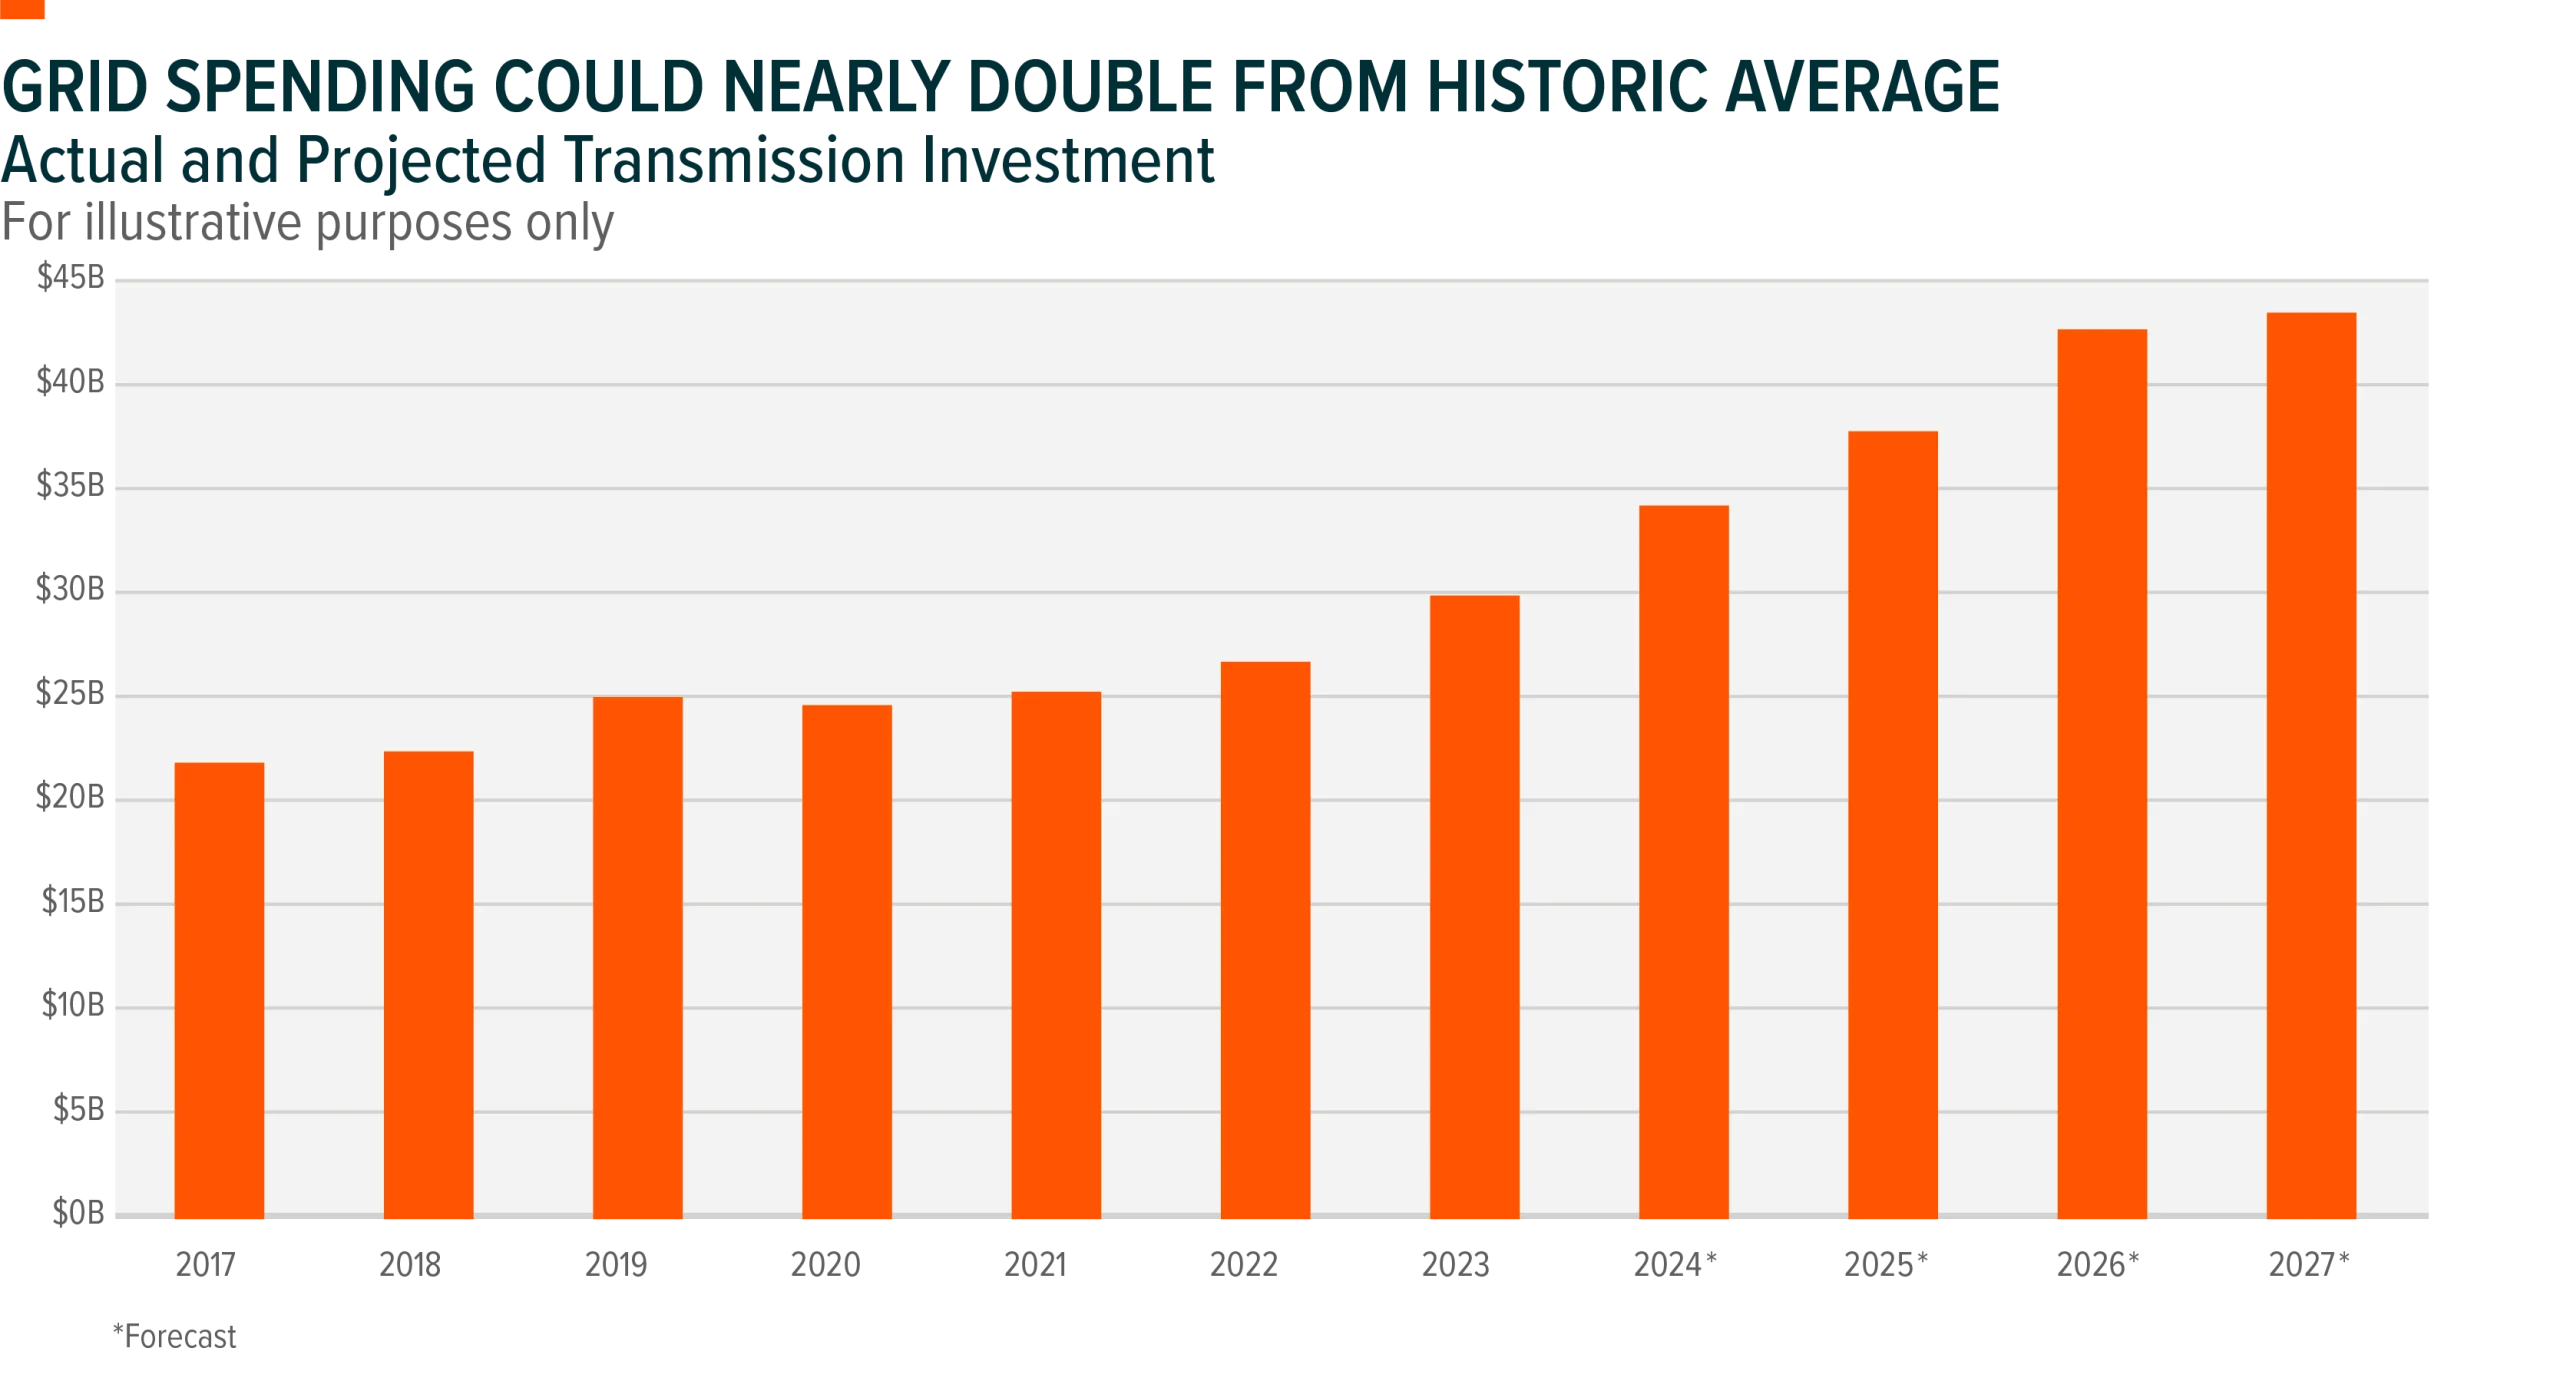
At the same time, manufacturing reshoring and domestic investment are driving demand for factories, transportation networks, utilities, and logistics infrastructure. More than $1.2 trillion in new U.S. production investments were announced in 2025 alone.
This surge in investment is occurring alongside significant fiscal support. U.S. policy initiatives—including the Infrastructure Investment and Jobs Act, the Inflation Reduction Act, and the CHIPS and Science Act—collectively represent roughly $1 trillion in government support for infrastructure, manufacturing, and technology development.
The investment opportunity increasingly lies with the companies that build and supply this infrastructure: construction firms, engineering companies, industrial manufacturers, materials suppliers, transportation providers, and equipment producers. These businesses are positioned to benefit directly from rising capital expenditure across the economy.
Infrastructure also offers portfolio diversification benefits. While infrastructure stocks provide equity exposure, they also share characteristics with real assets, often benefiting from long‑term investment cycles and inflation‑linked demand. As a result, infrastructure can serve as a complementary allocation alongside core equity exposure.
Key Takeaways
• Commodities are increasingly viewed as a core portfolio allocation due to diversification benefits and inflation sensitivity.
• Commodity producers offer operating leverage to rising commodity prices and currently appear attractively valued relative to history.
• Structural demand drivers support commodities such as copper, uranium, and silver.
• Infrastructure investment is accelerating as AI, electrification, and manufacturing reshoring drive large‑scale capital spending.
• Infrastructure companies play a significant role in supporting AI and reindustrialization cycle.

Outlook for Two Metals: Structural Demand Supports Silver and Copper
Rising demand from electrification, artificial intelligence infrastructure, and advanced technologies continues to reshape the outlook for key industrial metals. Among the most notable examples are silver and copper, two commodities increasingly tied to the global energy transition and digital infrastructure buildout.
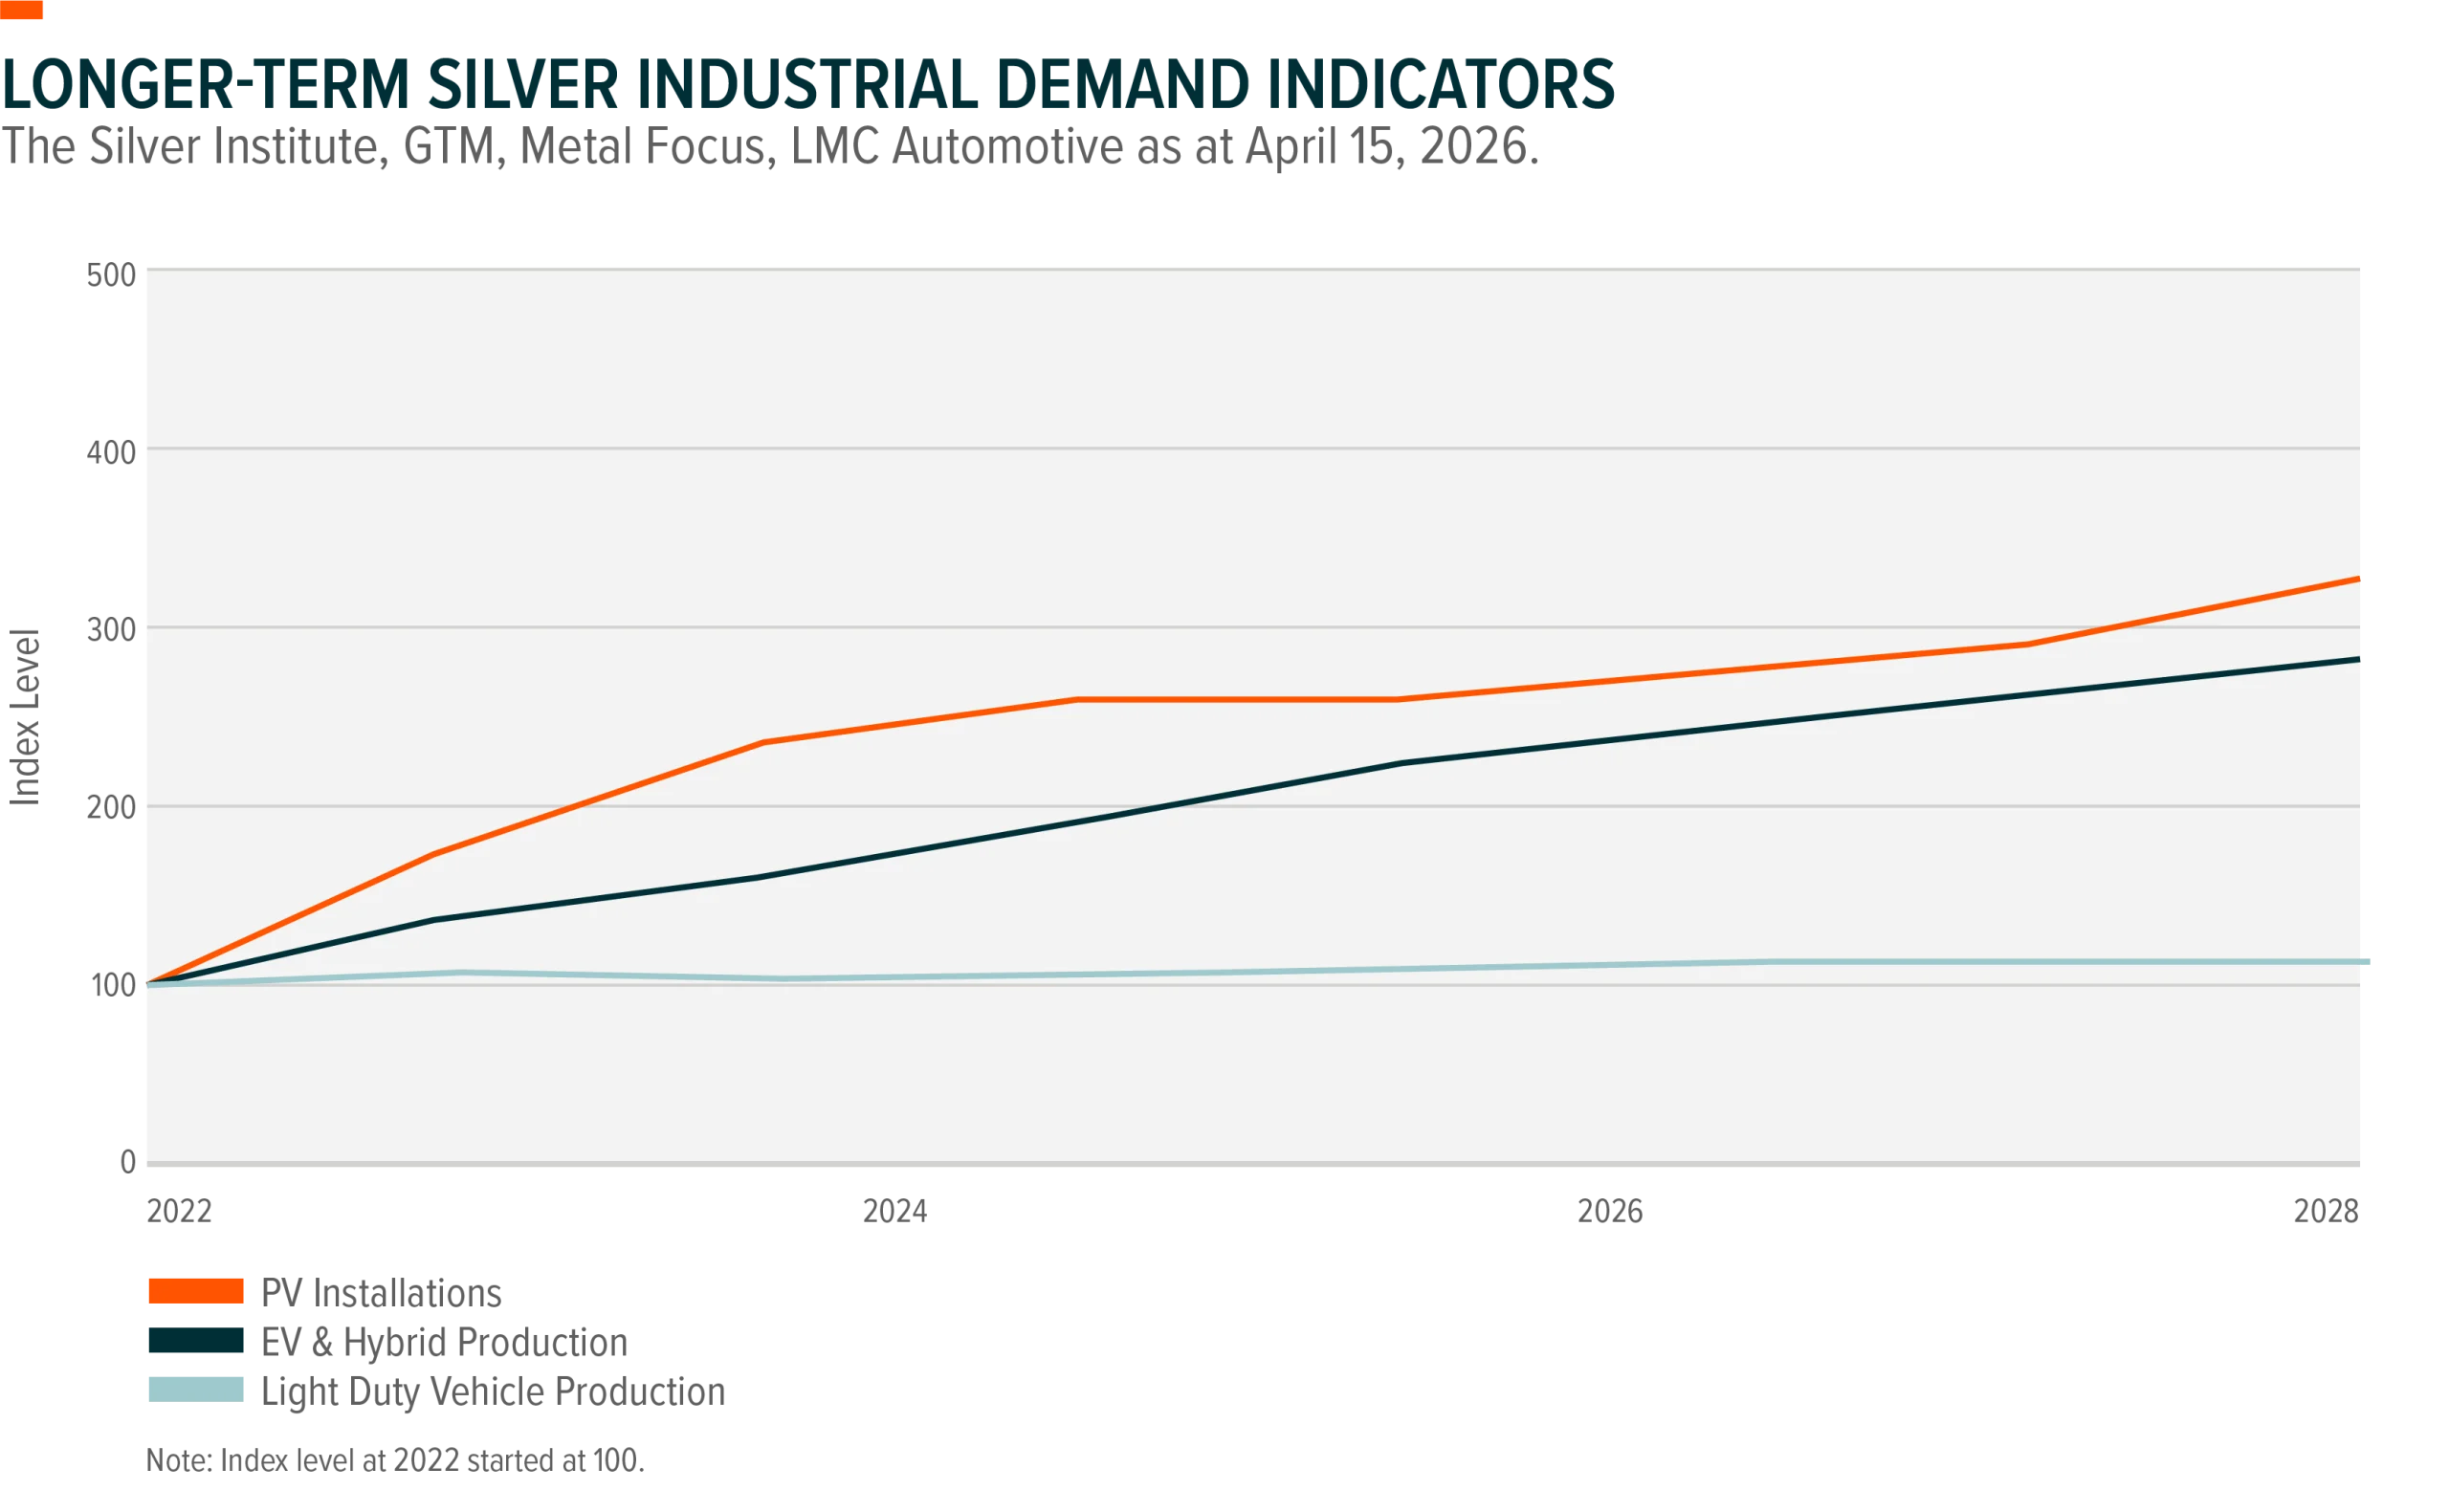
Silver: Industrial Demand Driving a Structural Deficit
Silver occupies a unique position in commodity markets as both a precious metal and an industrial input. Approximately 58% of annual silver demand is tied to industrial uses, including electronics, solar panels, electric vehicles, and healthcare applications. As these sectors expand, industrial demand continues to play a central role in shaping the silver market.
The global silver market is expected to remain in a structural deficit. This year’s supply shortfall is projected to widen by roughly 15% to approximately 46.3 million ounces. On the supply side, mine production has remained constrained while producer hedging activity has declined. Increased recycling may partially offset these pressures, but overall supply growth is expected to remain limited.
At the same time, higher silver prices could begin to moderate certain areas of demand. Substitution and efficiency improvements may reduce silver intensity in applications such as photovoltaic solar panels, while demand from jewelry and silverware could soften if prices remain elevated.
However, structural demand tied to electrification, data centers, automotive technology, infrastructure development, and investment demand through ETFs may continue to support the market. Over time, the silver market may move toward a more balanced state, but a sustained supply surplus appears unlikely in the near term.
Because the silver market is relatively small compared with other commodity markets, shifts in investor positioning can have an outsized impact on price dynamics. If institutional or investor demand increases meaningfully during a period of structural supply deficit, prices could respond quickly.
1 Source: The Silver Institute as at April 15, 2026: Elevated Lease Rates, Regional Liquidity Tightness, and Robust Investor Interest Resulted in Record Silver Prices in 2025.
2 Source: Silver Institute, World Silver Survey 2026 (April 15, 2026)
Copper: The Backbone of Electrification and AI Infrastructure
Copper plays an equally significant role in the global transition toward electrification and digital infrastructure. As the backbone of renewable energy systems, electric vehicles, power grids, and artificial intelligence infrastructure, copper demand continues to expand across multiple sectors.
Rapid growth in cloud computing and artificial intelligence is fueling sustained demand for data center capacity as hyperscalers and corporations expand their digital infrastructure. These facilities require enormous amounts of electricity and power distribution capacity, both of which rely heavily on copper.
In the United States alone, data centers are expected to require just over 100 gigawatts of power by 2035, equivalent to the electricity consumption of roughly 20 cities the size of New York.
At the same time, supply growth remains constrained. Chile, the world’s largest copper producer, has lowered its production forecasts for both 2026 and 2027, reinforcing expectations that global copper supply may struggle to keep pace with long‑term demand growth.
These supply challenges, combined with expanding demand from electrification and AI infrastructure, have tightened market conditions and contributed to higher price volatility. While investors increasingly recognize copper’s strategic importance, many analysts believe the long‑term impact of structural supply shortages may not yet be fully reflected in market pricing.
1 Source: Bloomberg News as at April 21, 2026: Supply Crunch Threatens U.S. Need for 106 Gigawatts of New Power.
2 Source: Bloomberg News as at May 19, 2026, Chile Lowers Copper Production Outlook, Raises Price Forecasts
Key Takeaways
• Industrial demand accounts for roughly 58% of global silver consumption.
• The silver market is expected to remain in a structural deficit, with shortages projected to widen this year.
• Because the silver investment market is relatively small, changes in investor demand can significantly impact prices.
• Copper demand is being driven by electrification, renewable energy systems, and expanding AI infrastructure. • Supply constraints, particularly in major producing countries, may keep copper markets tight in the years ahead.

Canada’s ETF Evolution: The Rise of the Self‑Directed Investor
Canada’s investment landscape has been undergoing a meaningful shift. Historically dominated by advisors and bank‑led distribution, the market is increasingly evolving toward a hybrid model where self‑directed investors are playing a larger role in trading activity and product innovation.
At the center of this transition is the growing popularity of exchange‑traded funds. ETFs are increasingly becoming the preferred investment vehicle for many investors.
Within the ETF market, one of the fastest‑growing segments has been leveraged exposure. Much of this growth has been driven by retail investors seeking tactical trading tools or income-oriented strategies. Leveraged ETFs now come in a variety of formats, ranging from traditional daily‑reset products that provide two‑times or three‑times exposure to indexes or sectors, to newer structures such as single‑stock leveraged ETFs and covered call strategies that use modest leverage to enhance yield.
While leveraged products can appear riskier based on traditional metrics, they have increasingly found a place among self‑directed investors who actively manage their portfolios. According to National Bank Capital Markets, assets in inverse and leveraged ETFs have grown by more than $4 billion year‑to‑date through May 15, 2025, highlighting the strong demand for tactical trading tools.
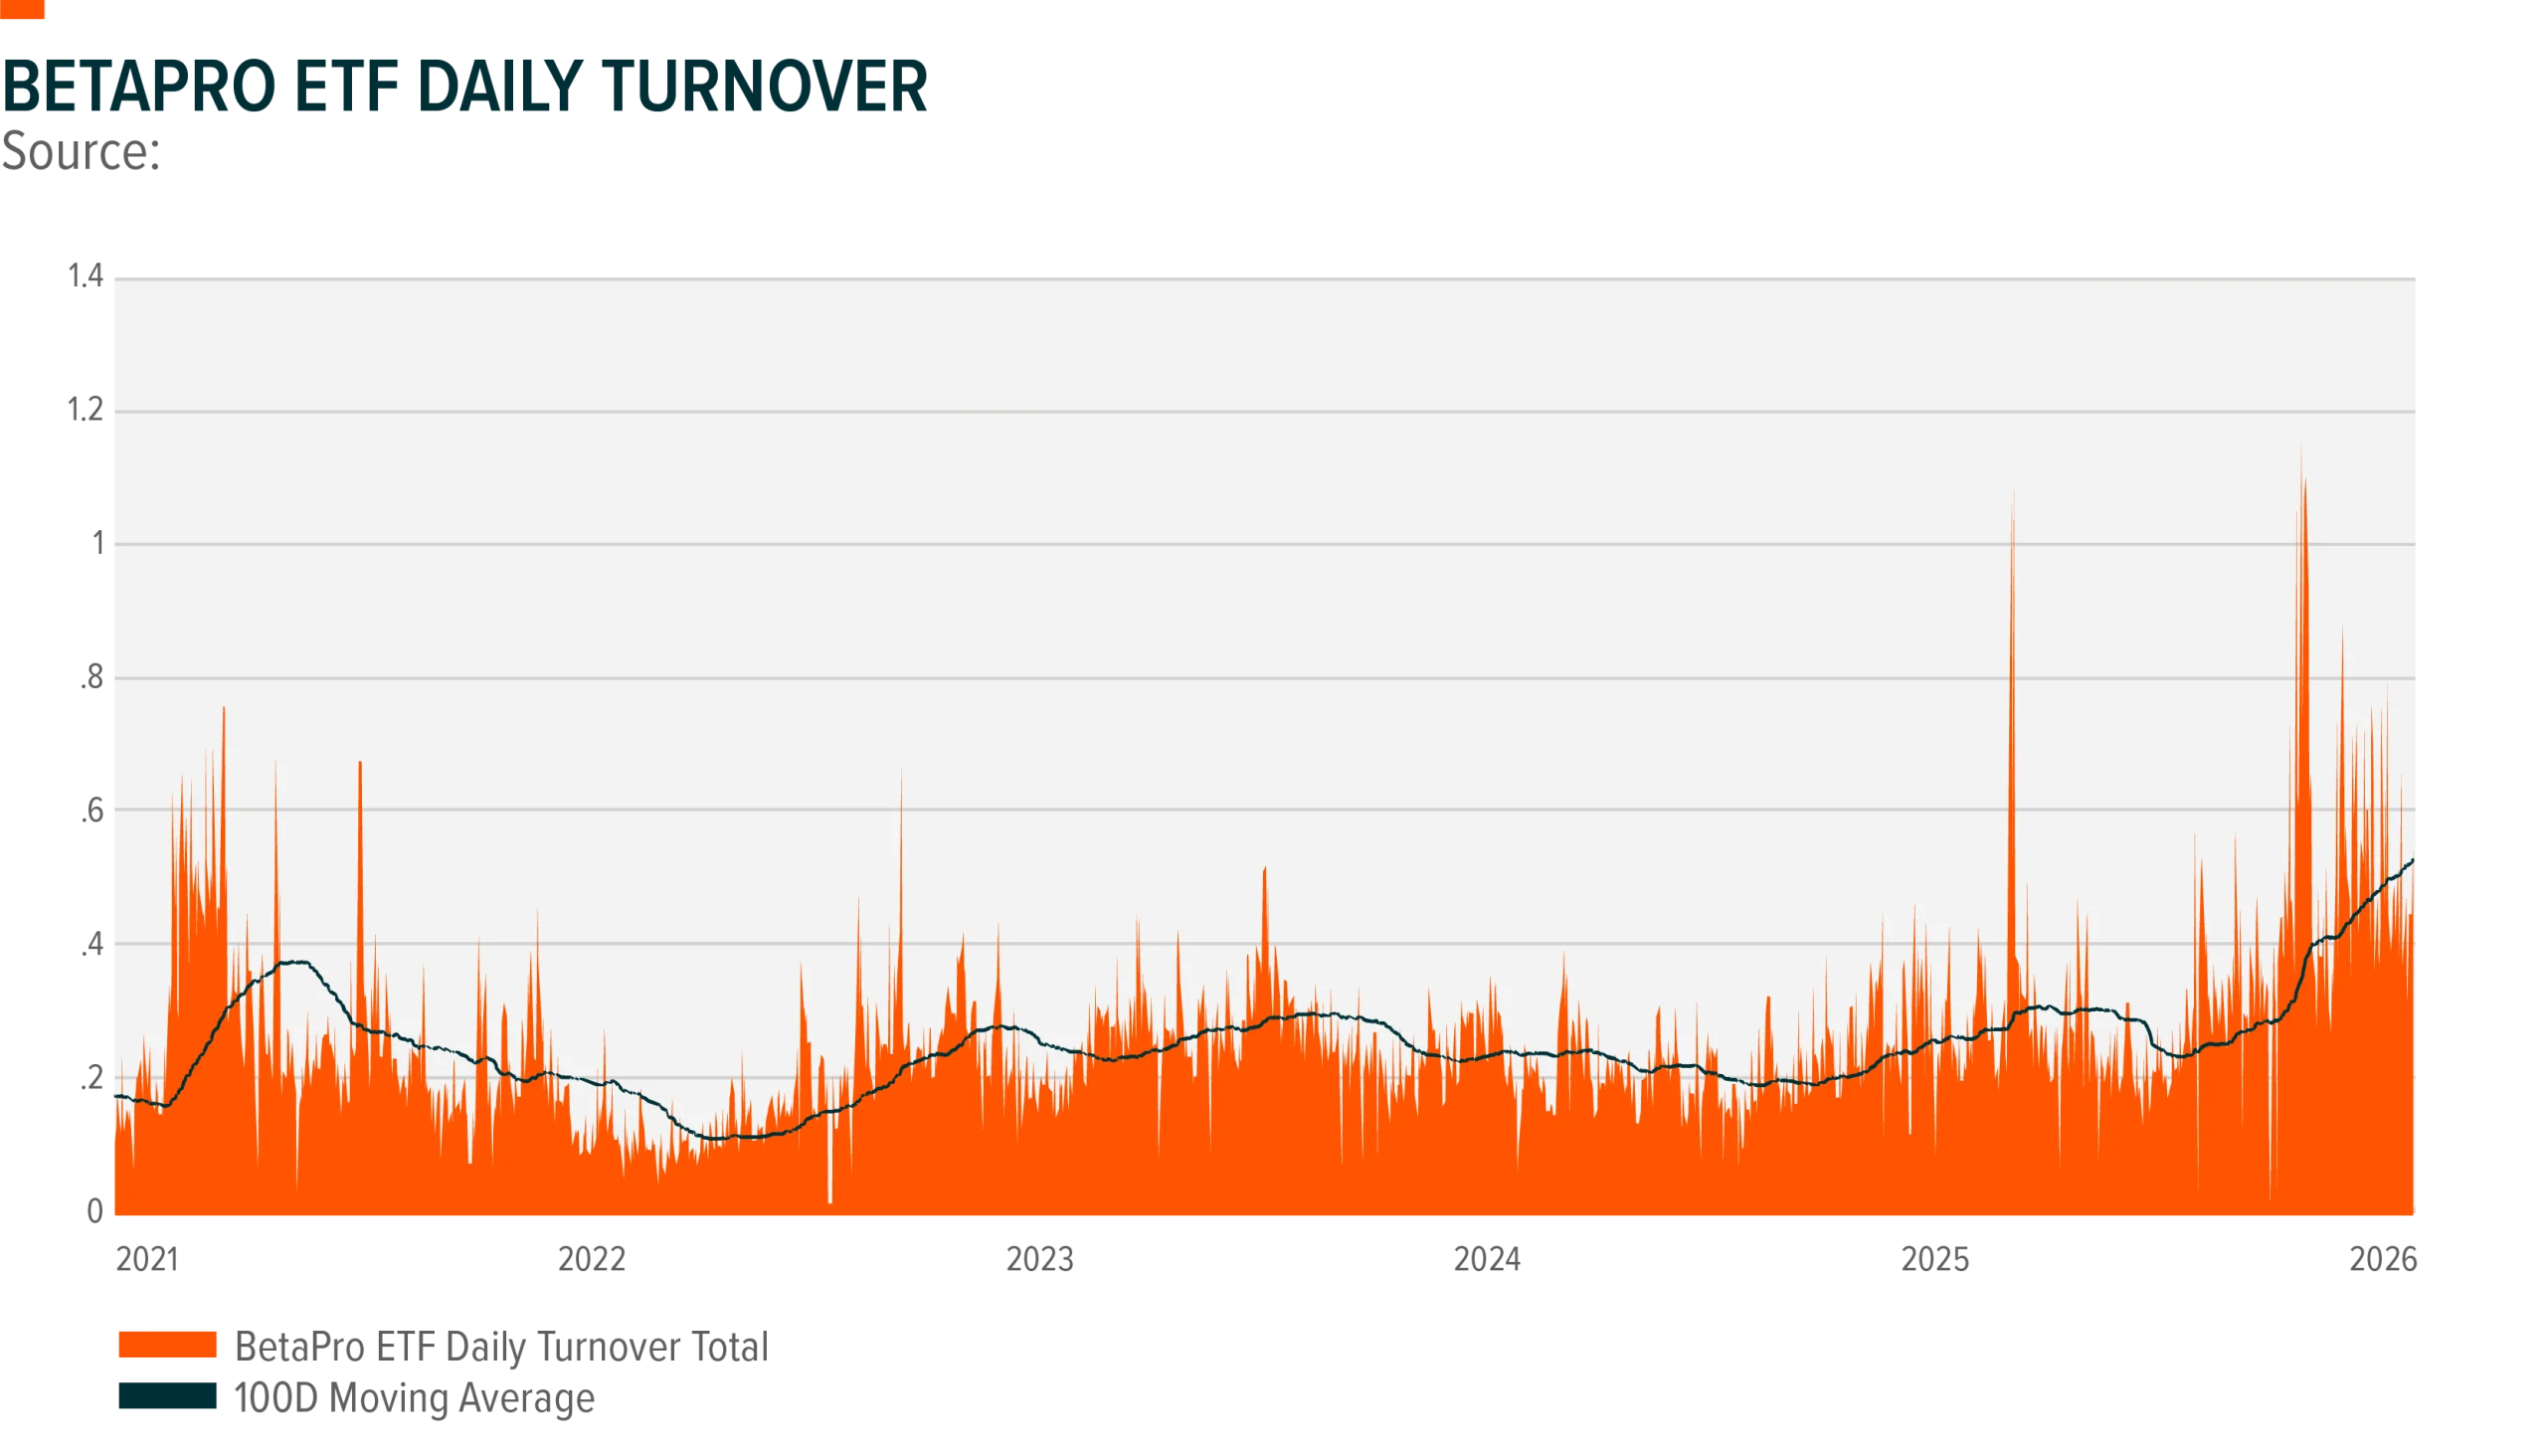
At Global X, this trend is reflected in the growth of the BetaPro lineup, which represents the largest suite of traditional two‑times and three‑times leveraged ETFs in Canada. Trading activity in the BetaPro family surged during the COVID‑era retail trading boom, and in recent months has exceeded those earlier peaks as both the investor base and product offerings have expanded.
One important contributor to this growth has been the introduction of three‑times leveraged ETFs in June 2025. These products provide amplified exposure to widely followed markets such as semiconductors, the Nasdaq‑100, and the S&P 500, giving investors additional tactical tools for expressing short‑term market views.
As leveraged ETFs continue to gain traction, it is important for investors to understand how these products are designed to be used. Because they target daily performance objectives and can experience amplified volatility, leveraged ETFs are generally intended for short‑term tactical positioning rather than long‑term buy‑and‑hold strategies.
Investors should consider several best practices when trading leveraged ETFs, including using limit orders rather than market orders, avoiding trading near the market open or close when spreads may be wider, monitoring position sizes carefully, and ensuring that holding periods align with the product’s intended daily objective.
As with any investment, understanding the structure and risks, including the potential for amplified losses, is essential. When used appropriately within a broader portfolio strategy, leveraged ETFs can serve as effective tools for tactical positioning and portfolio management.
Key Takeaways
• Canada’s investment landscape is evolving as self‑directed investors become a larger force in markets.
• ETFs are increasingly replacing traditional investment vehicles as core portfolio holdings.
• Leveraged ETFs represent one of the fastest‑growing segments of the ETF market.
• Retail investors are driving demand for tactical tools such as 2x and 3x leveraged exposures.
• Leveraged ETFs are generally designed for short-term tactical exposure and require active risk management.