The year saw North American equities advancing despite tariff uncertainty and political shocks. Central banks on both sides of the border cut rates as inflation eased, while labour markets softened, growth slowed unevenly, and gold rallied alongside volatile crude.
This piece “joins the dots” and explores these market dynamics and their potential impacts in the year ahead.

North America Faces Diverging Economic Paths
Canada enters 2026 facing slowing momentum, shifting growth drivers, and heightened sensitivity to global trade and commodity trends. Heading into 2026, the Canadian economy is in a challenging position. Despite a surprising GDP print of 2.6% annualized growth in Q3 2025, the Canadian economy is facing a slowdown in consumer spending, largely driven by tariffs and lower levels of global trade. Early data suggests Q4 2025 growth is slowing from the elevated rate in Q3. The Bank of Canada estimates real GDP growth in 2026 will be just 1.1%.
In addition, the economy will not be able to count on the growth engine of recent years: immigration. The positive impact on economic growth from immigration is expected to decline in 2026 as overall population growth is set to slow down.
Fiscal stimulus from recently announced measures will be counted on to provide a boost to Canadian economic activity in 2026, as federal infrastructure programs are rolled out. Another potential area of support is in global demand for commodities. Canadian gold miners have benefitted from the strong rise in gold prices in 2025. There is potential for this effect to broaden into other commodities that are in global demand, such as copper, lithium and uranium as the artificial intelligence (AI) buildout continues and keeps these raw materials in demand.
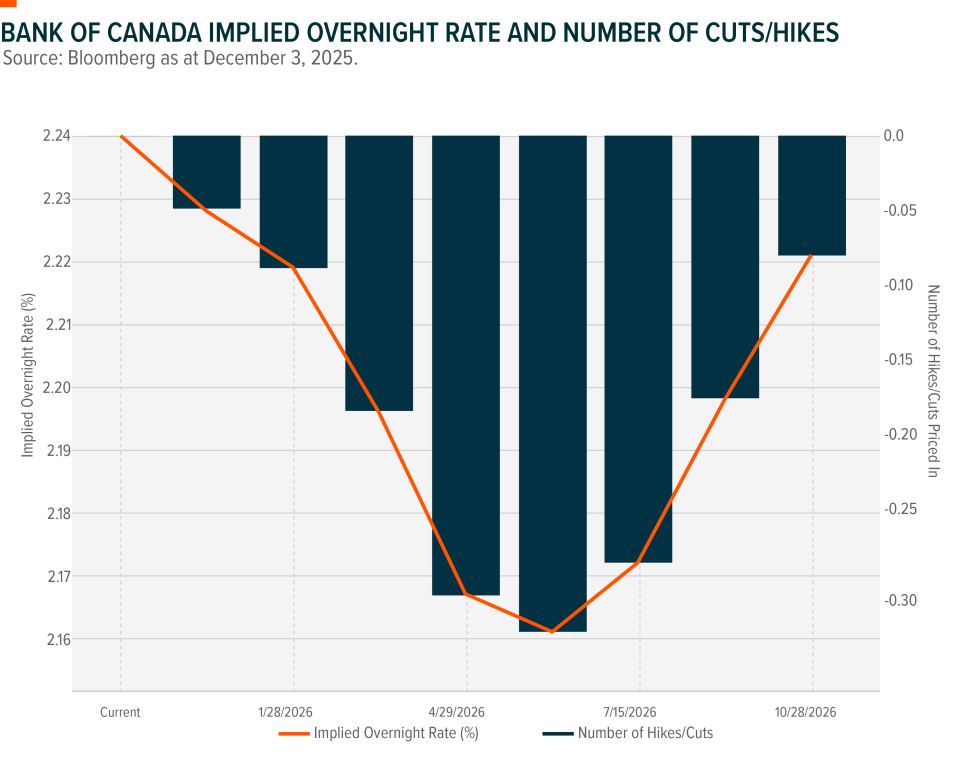
While the market is not expecting any further rate cuts from the Bank of Canada (BoC), that could change if economic conditions deteriorate meaningfully. The BoC remains ready to support the economy should overall growth remain low.
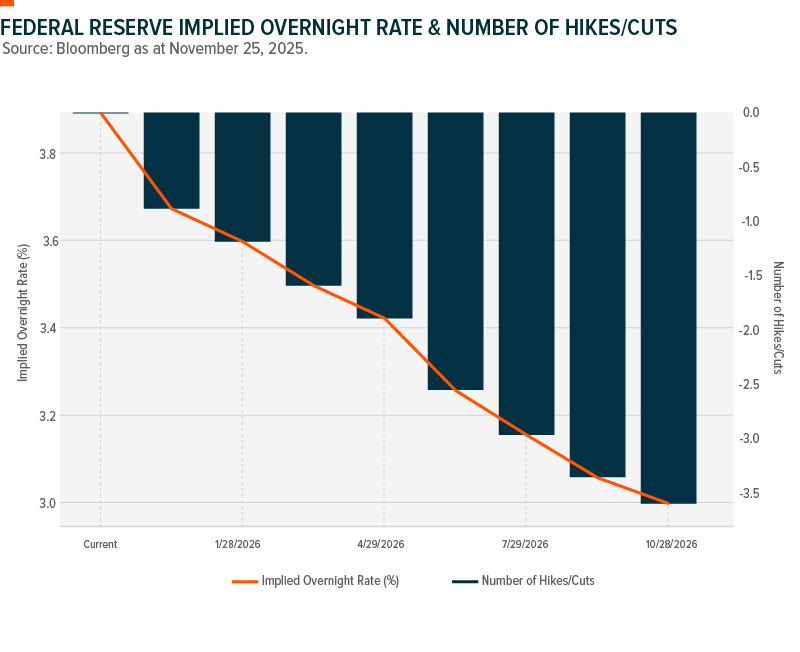
In the United States, tightening labour conditions, tariff pressures, and shifting policy expectations are shaping the economic outlook for 2026. For the U.S., we believe a tight labour market should maintain upward pressure on wages. Supply of labour remains an issue south of the border where they have taken a hard-line approach to immigration. There is also the potential for consumer prices to continue trending upwards, as businesses continue to slowly pass along the higher costs associated with tariffs. We also expect the yield curve to continue steepening as short rates come down, and long rates remain anchored due to concerns on inflation from the aforementioned tariff impact and continued wage growth.
Moving into the second half of the year, there is the possibility of quantitative easing (QE) or similar accommodative policy being enacted as the country heads into mid-term elections to keep a lid on yields and stimulate economic activity. The continued build out of AI infrastructure through 2026 should maintain economic momentum, and the demand for commodities, materials and energy to build and power this new industry.

2026 Fed Strain Shapes Fixed Income
Fed mandates diverge as labour weakens and inflation persists, straining policy flexibility entering 2026 fixed income markets. As 2026 approaches, the U.S. Federal Reserve (Fed) faces increasing pressure as its dual mandate of maximum employment and price stability remains under strain. The labour market is showing continued weakness while inflation remains more stubborn than expected, making it difficult for policymakers to balance both objectives. This divergence complicates effective monetary manoeuvring. Speculation has emerged around the cessation of quantitative tightening, which could inject additional liquidity into markets and potentially push bond yields lower. There is also discussion around the possibility of yield curve control, with a bias toward purchasing long-dated bonds. Such measures could help contain inflation’s impact on the long end of the curve, though they introduce further complexity and uncertainty into the policy outlook.
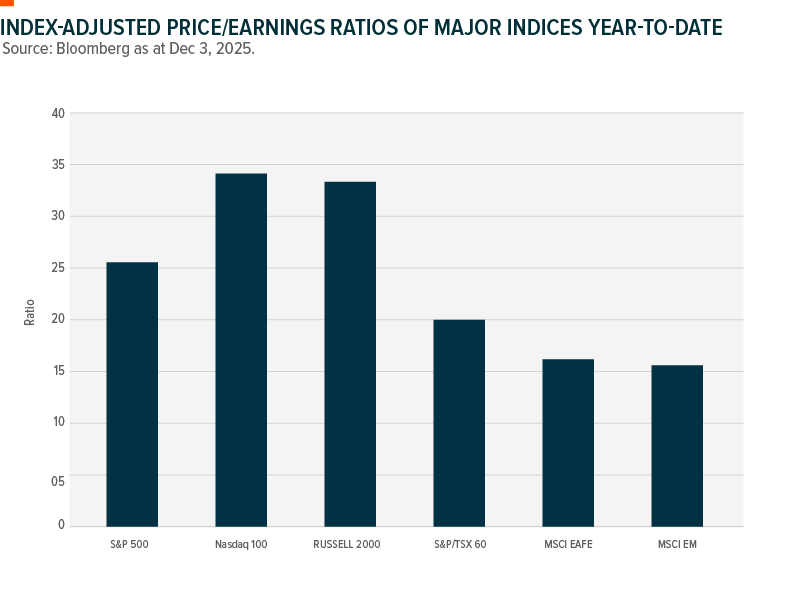
Slowing growth and elevated valuations may prompt a rotation from equities into bonds, offering more attractive risk-return profiles. Economic growth forecasts are being revised downward as trade tensions and persistent policy uncertainty weigh on confidence. At the same time, equity market valuations remain elevated, with the S&P 500 trading above 25 times earnings. This disconnect between softer growth expectations and high valuations may encourage investors to reconsider portfolio positioning. In this environment, bonds may appear more compelling from a risk-return perspective compared with equities. The potential for additional liquidity from a pause in quantitative tightening could further support fixed income assets. As investors look ahead to 2026, the relative appeal of bonds may increase, particularly if equity markets struggle to justify current valuations amid slowing economic momentum and uncertain global trade conditions.
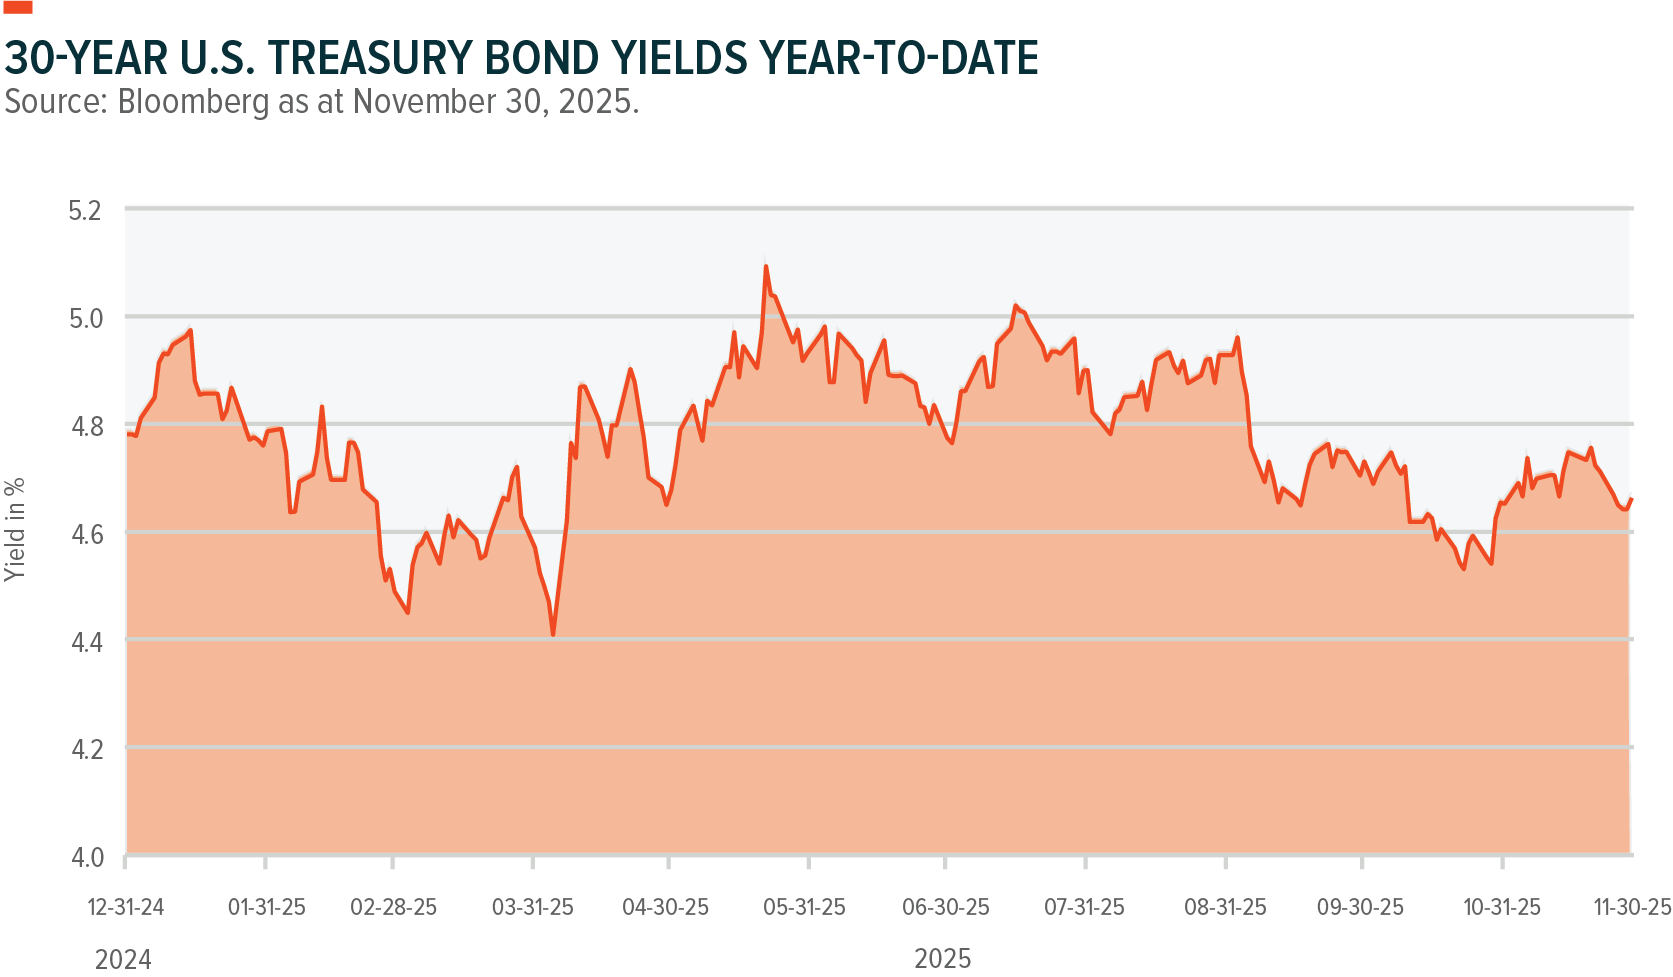
Extending duration appears tactical as term premiums increase, though sticky inflation and volatility remain primary investor risks. Extending duration in fixed income portfolios may represent a tactical opportunity in 2026. 30-year U.S. Treasury yields have repeatedly tried to rise above the 5% resistance level but have been rejected following event-driven spikes, highlighting sensitivity to macro shocks. The term premium remains attractive, while the front end of the yield curve already prices in further rate cuts, making longer maturities more appealing. However, the primary risk remains inflation. Potential government shutdowns and reduced economic data transparency could lead to persistent inflation, keeping long-end yields elevated. Investors must balance the potential benefits of extending duration against exposure to volatility and uncertain inflation dynamics.
Volatility and Covered Calls
Volatility in 2026 is expected to stay elevated, driven by fundamentals, reallocations and concentrated risks. Overall expectations are for continued volatility in 2026 but driven less by headline risk and more by market fundamentals and asset re-allocation. The difficult environment in the U.S. in 2025 may have investors continuing to look elsewhere for investment opportunities. Given liquidity is not the same across asset classes or sectors, larger asset re-allocations could spur market volatility.
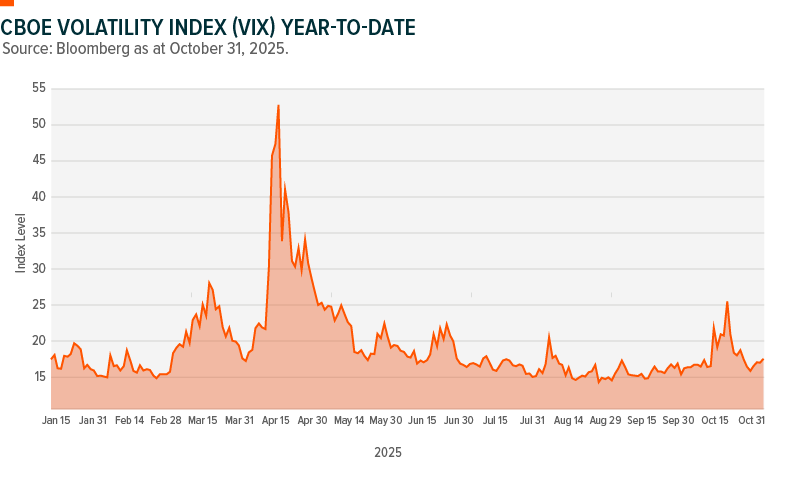
The volatility index (VIX) in 2025 was, on average, slightly higher than the previous year, which was warranted given the U.S. administration’s layering of uncertainty into all markets. In addition, VIX volume also averaged higher in 2025, suggesting that movements in the VIX index happen quicker, suggesting the reaction function to S&P 500 Index (SPX) market movements is more sensitive than average, which aligns with the quicker recovery upon drawdowns in 2025. Increase in concentration risk of the larger indices, elevated price-to-earnings ratios and an ever-changing AI landscape could drive above-average volatility in 2026, where one earnings miss from a mega-cap technology company could trigger a market-wide correction.
Precious Metals and Energy
Precious metals and energy remain in focus after 2025’s rally, volatility spikes and supportive fundamentals. Precious metals continue to be very topical given the 2025 bull run for both gold and silver, backed by fundamental shifts in the economic landscape and supply-side constraints.
We saw profit-taking in this space around mid-October of 2025. Given the length and magnitude of the rally, leveraged and derivatives positioning caused a surge in volatility during the period. These liquidity events tend to be outliers when compared to volatility averages, but given the underlying theme and fundamentals remain topical, we could see similar events next year. This will support yield generated in the options markets, providing attractive distributions on an otherwise non-yielding asset base.
As the link between power generation and AI infrastructure becomes more critical by the quarter, the commodity super-cycle theme will be one to look for in 2026. With positive fundamental support and modest valuations, this sector could be well supported as the base of a covered call strategy for 2026. This is a sector with higher-than-average volatility, great for generating premiums. We also note that geopolitical tensions in Europe (Russia/Ukraine) and the Middle East can spike volatility overnight, but we do see diminished risk versus 2025, with peace talks slightly gaining ground in both regions.

Global Equity Themes Shaping the 2026 Outlook
Canadian equities have shown strong year-to-date performance. Record highs in gold and silver have supported the TSX 60, where significant materials exposure has helped it outperform several U.S. benchmarks. While the index appears to be narrowing the growth gap, recession risks and shifting U.S. trade dynamics may add volatility in 2026.
U.S. Large-Cap and AI-Driven Growth Outlook
We hold a moderately optimistic view for the S&P 500 in 2026, with performance dependent on whether profit growth can validate elevated valuations. The expiration of Chair Powell’s term in May means the tone of the new Federal Reserve leader will shape expectations for the pace of rate cuts, where a more dovish stance could support equities. For the Nasdaq 100, AI remains the central structural driver, and early-cycle adoption suggests momentum into 2026. However, its concentration means any earnings disappointment from key mega-cap names could weigh heavily on overall results.

Small-Caps and Sensitivity to Domestic Conditions
The Russell 2000 continues to reflect the health of the U.S. domestic economy: more exposed to cyclical sectors and more sensitive to shifts in credit conditions, liquidity trends, and consumer demand. Recent stresses in the U.S. private credit market introduce an additional source of uncertainty as 2026 approaches. These dynamics leave small-caps more vulnerable to swings in financial conditions relative to larger benchmarks, keeping their outlook closely tied to the stability of credit markets and broader economic momentum.
International & Emerging Markets Enter 2026 With Constructive Backdrops
Equity markets across Europe, Australasia, and the Far East are having a broadly constructive year, supported by appealing valuations and stable economic expansions as global investors diversify away from the technology-heavy U.S. market. The finalization of new U.S. trade agreements and any de-escalation of the Ukraine crisis could further benefit the MSCI EAFE index. Emerging markets have also delivered strong returns, helped by easing trade tensions between the U.S., China, and India. Rising capital inflows into Latin America add to improving sentiment that may support MSCI EM performance into 2026.
“Index-Adjusted P/E Ratios of Major Indices Year-To-Date”

China Tech Momentum Entering 2026 Strengthens
China’s technology sector is delivering durable, cost-driven momentum supported by scalable AI commercialization, favourable policy shifts, and expanding sector breadth. With strong 2025 outperformance, improving investability, and structural competitive advantages across key sub-sectors, these dynamics position the Hang Seng TECH Index as a credible source of growth heading into 2026.

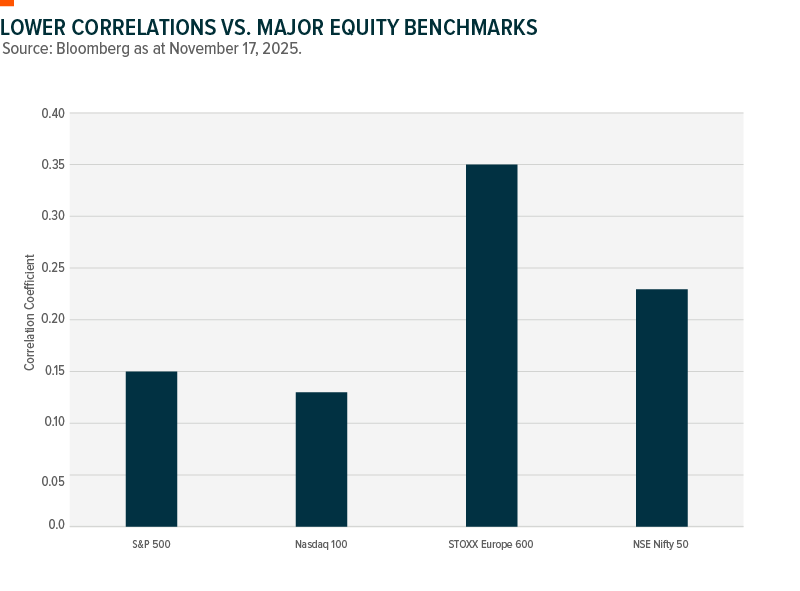
Outperformance reflects durable, investible momentum driven by cost-efficient Artificial Intelligence (AI) innovation and a deeper digital economy. Not a short-term rebound. The Hang Seng TECH Index has materially outpaced U.S. equities and North American Tech benchmarks in 2025, fueled by China’s competitive cost advantages emerging among Chinese AI firms, DeepSeek and the rapid expansion of its digital economy. Lower-cost AI model deployments along with scalable commercialization are strengthening earnings visibility and narrowing the economics gap versus Western peers while domestic demand provides a powerful internal growth engine. China’s digital economy has reached an economically meaningful scale. This combination makes the rally more structural than speculative, with credible growth drivers rather than a short-lived bounce. This positions the theme as a source of growth heading into 2026.
Policy and market reforms have turned from headwinds to tailwinds, tightening the window of opportunity. Easing regulations, supportive industrial policy, Hong Kong market reforms over the last 12 to 18 months and renewed foreign inflows are improving the investability of Hang Seng-listed tech names. The shift towards commercialization and cross-border capital access increases the probability that recent momentum will persist into 2026. This provides us with a near-term opportunity to establish positions while policy and sentiment remain aligned.
Structural competitive advantages and sector breadth: manufacturing scale, A.I. commercialization and concentrated leadership in the Hang Seng TECH Index, China already leads in several strategic tech sub-sectors, from electric vehicles (EVs) to Robotics, and is commercializing AI at a lower cost curve yet greater scale points. Those advantages expand the investable universe beyond pure internet stories to include cloud, fintech, semiconductors, next-generation hardware and advanced manufacturing. The Hang Seng TECH cohort is concentrated among a relatively small set of market leaders. This offers asymmetric upside (albeit with higher volatility) if these companies continue executing, but also carries idiosyncratic, macro and regulatory risks. For diversified portfolios, a modest allocation provides differentiated exposures to a growing yet maturing and globally-competitive tech ecosystem.
Related ETF
AI Infrastructure Constraints Strengthen Multi-Year Growth Outlook
AI infrastructure remains capacity-constrained across compute, semiconductors, and power, supporting premium pricing and sustained revenue visibility. Expanding chip backlogs, diversified supplier demand, and rising electricity needs highlight a multi-year buildout cycle. These structural bottlenecks create a compelling, longer-duration opportunity for companies enabling efficient, reliable AI deployment heading into 2026.
Compute capacity – including data centers, hardware, power and graphics processing units (GPUs) – remains chronically constrained; commanding pricing power and creating durable cash flows for operators, systems and input providers. Hyperscaler buildouts and long, multi-year leases have pushed vacancy rates to record, historic lows. Major cloud providers report demand that exceeds available AI capacity, leaving GPUs sitting in inventory for lack of power or connectivity. In many cases, GPUs cannot be installed because of limited power or rack connectivity. This scarcity and supply-side bottlenecks support premium rents and long-term revenue growth for data center suppliers, colocation providers, inputs and infrastructure integrators.
The semiconductor opportunity is now entering a broader, multi-year growth phase that extends well beyond any single vendor or chip type. To navigate this evolving landscape effectively, a diversified exposure across GPUs, ASICs (Application-Specific Integrated Circuits), memory and networking because hardware demand is increasingly important and is being broadened by hyperscaler in-house chips and big vendor backlogs . Nvidia’s recent backlog comments illustrate massive near-term demand for next-gen chips, while OpenAI’s recent deals with Broadcom and AMD confirm hyperscalers are diversifying suppliers and accelerating custom-chip programs. Large backlogs for chips and accelerating custom-chip programs create a multi-year revenue opportunity for semiconductor providers.
Constraints on power, cooling and grid make the theme longer duration, lengthening infrastructure cycles and therefore elevating the role of critical electrification and thermal-management solutions. Forecasts show data centers could consume roughly 6.7- 12% of US electricity by the late 2020s, making grid upgrades, on-site generation, modular power and advanced cooling multi-year priorities. Data Center electricity demand is set to surge. Multiple factors, including hyperscaler capex, chip backlogs and power grid pressure, create a compelling outlook for companies that enable reliable, efficient AI deployment as the market shifts from capacity towards monetization. This makes 2026 a materially attractive entry window.


Gold Continues to Have Strong Tailwinds Entering 2026
Gold has so far performed well in 2025, rising 53%1 for the year to date as at October 30, 2025. There have been some pullbacks during the year, but nothing significant. Gold received a lot of media attention reaching all-time highs in 2025. Still, retail and institutional investors in North American markets have not been big buyers of the yellow metal – yet. Most of the gold-buying has come from non-Western central banks and retail investors in Asia. Currently, the average institutional portfolio holds around 4% in gold, which is far below historical norms. In 2026 if Western investors start to become more interested in gold, this would be a significant tailwind for gold to move higher.
As governments around the world continue to ramp up their deficit spending, investors have become concerned about the debasement of Western currencies. The debasement trade has become a significant tailwind for gold prices in 2026.
Central banks strongly ramped up their gold-buying in 2025 and continue to be large purchasers of gold, beginning their purchasing around 2022. 2025 saw a milestone with gold becoming a larger share of foreign reserves compared to U.S. dollars. There are currently no signs that large central bank purchases of gold are slowing down, so this is a significant tailwind for gold in 2026.
1 Source: Bloomberg as at October 31, 2025

Commodity Supercycle Coming Up
Super cycles do not happen in a vacuum. They occur after years of investor disinterest in a sector of the market. In the late 1990’s investors were hyper-focused on the technology sector and the result was disinterest in the commodity sector. When investors became less interested in the technology sector due to a significant correction, commodities started to shine and a super cycle for commodities was born in late 2001 and lasted until 2007.
Today, there are forecasted shortages in commodities such as copper, uranium, silver and many others. The world needs more commodities, especially to fulfill a transition to sustainable energy sources. Currently, investors are focused on technology and AI. Although the most likely catalyst for a commodity super cycle will be waning investor interest in the technology and AI space, it is not a necessary condition. The commodity super cycle will not announce itself. It will start with some commodities performing particularly well and others joining the outperformance trend over time. In 2025, a number of commodities have performed well, including copper, gold, silver and uranium. The outlook for commodities in 2026 is strong. Perhaps 2026 is the start of the commodity super cycle?


Positioning Equity Portfolios for Shifting Cycles
Over the next five years, equity returns for Canadian investors may diverge across scenarios driven by fundamentals, valuations, and regional growth trends. Understanding how earnings, inflation, and valuation dynamics interact while maintaining disciplined diversification offers a clear methodology for assessing return potential and positioning portfolios for varying macro environments.
Forward-Looking Scenarios for the Next Five Years
Canadian investors face three potential five-year equity paths: a fundamentals-driven base case, a valuation-reset correction, and a momentum-oriented growth trend. Dividend yields, compressed since 2022, are expected to stabilize near five-year averages. Earnings growth aligns with GDP expectations: at least 2% annually in the U.S., softer in Canada and Europe, Australasia and the Far East (EAFE), and around 4% in Emerging Markets (EM), with China slowing. Inflation may remain sticky near 3% globally. Valuations vary by scenario: neutral in the base case, mean-reverting in a correction, and extending past trends in growth which shapes the return outlook for Canadian equity allocations.
| Equities | Base Case | Correction | Growth Trend |
| US | 46% | 0% | 60% |
| CA | 25% | 25% | 40% |
| EAFE | 16% | 70% | 0% |
| EM | 13% | 5% | 0% |
Table of hypothetical allocations is shown for illustrative purposes only
How Dividend Yields, Earnings, Inflation & Valuation Shape Outcomes
Dividend yields remain compressed, especially in the U.S., and may stay near five-year averages. Long-term earnings growth reflects GDP trends: stronger in the U.S., weaker in Canada and EAFE, and mixed in EM with China slowing. Inflation is expected to hover near 3% globally. Valuations drive scenario differences: neutral in the base case, reverting to five-year averages in a correction, which support EAFE and EM, and continuing past expansion in the growth scenario, favouring U.S. large-cap technology. Together, these factors define the building-block framework shaping medium-term expected equity returns.
The Central Role of Diversification in a Shifting Market Landscape
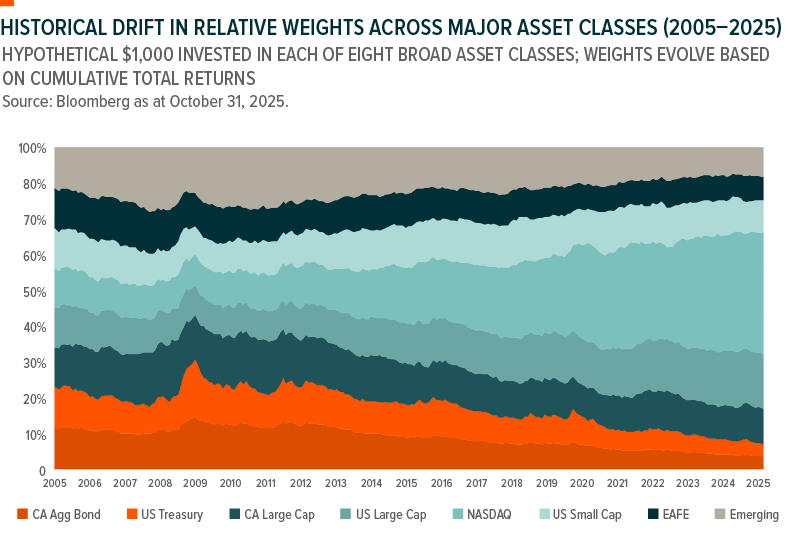
Portfolio diversification proved its value in early 2025 as U.S. equities lagged Canada, EAFE, and EM. Strategic diversification spreads exposure across markets with different cycles and characteristics, distinct from tail-risk hedging or short-term directional calls. Across the base case, correction, and growth scenarios, diversification stabilizes long-term outcomes: favouring fundamentals in the base case, supporting international strength in a valuation-driven correction, and maintaining exposure to North American momentum—including U.S. large-cap technology—in a growth trend. Diversification remains core to managing evolving macro conditions within a Canadian investor’s equity allocation.

Positioning Cash Allocations in an Uncertain Cycle
Canada’s rate environment is stabilizing near current levels, yet uncertainties around growth, inflation, and global risks continue to shape investor behaviour. In this backdrop, many are turning to High Interest Savings Account (HISA) ETFs for yield, flexibility, and liquidity. Understanding their role helps investors navigate a shifting macro landscape with confidence and discipline.
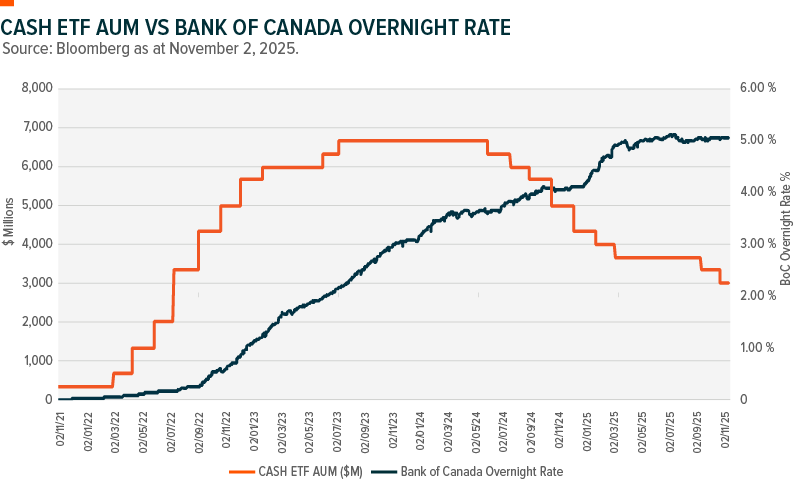
- Most analysts expect the Bank of Canada’s (BoC) overnight rate to remain around the current level of 2.25% through much of 2026, with minimal cuts unless inflation or growth surprise significantly. The BoC is signaling that the current rate is about the right level for holding inflation near its ~2% target while the Canadian economy navigates structural adjustments. At the same time, market uncertainties persist: weak growth, elevated global trade risks, sticky core inflation, and changing population dynamics all cloud the outlook. Because of this backdrop, many investors may choose to stay in HISA ETFs with the rationale being that these products provide competitive risk-adjusted yields, no credit risk, and maximum flexibility.
- Global X’s Global X High Interest Savings ETF (CASH) is Canada’s largest HISA ETF and is utilized by everyone from DIY investors to large institutions. In comparing assets and interest in CASH to BoC overnight rates, it is clear that even after 2.75% of total rate cuts since the high of 5% in June of 2024, investors still see a place for cash-like instruments in their portfolio. CASH invests almost all of its assets in high-interest deposit accounts with one or more Canadian chartered banks, which could provide a higher interest rate than a traditional savings account.
- HISA ETFs can be purchased or sold anytime throughout the trading day, a key advantage versus other high-interest savings vehicles, which typically have minimum holding periods or investment amounts. CASH is the most traded ETF in this category with an average of $77 million of turnover on a daily basis, and with tight spreads along the way. These benefits allow interested parties to get in and out of their allocation with minimal friction and with market uncertainty at the forefront, allow for an efficient vehicle to receive institutional level interest rates while you park your cash.