Strong earnings, deep capital buffers and global growth platforms have put Canadian banks and insurers ahead of the broader domestic market and other countries’ financial sectors.
32.84%
HBNK YTD return
24.81%
SAFE YTD return
13.57%
S&P / TSX 60 Index YTD return
Source: Global X, S&P, as at July 31, 2026
Canada’s stock market is often framed as a resources story. In 2026, however, financials have supplied much of the momentum. As of July 31, 2026, Canada’s banking and insurance industries, represented collectively by the Global X Equal Weight Canadian Banks Index ETF (HBNK) and the Global X Equal Weight Canadian Insurance Index ETF (SAFE) have outperformed the S&P/TSX 60 index by double digits.
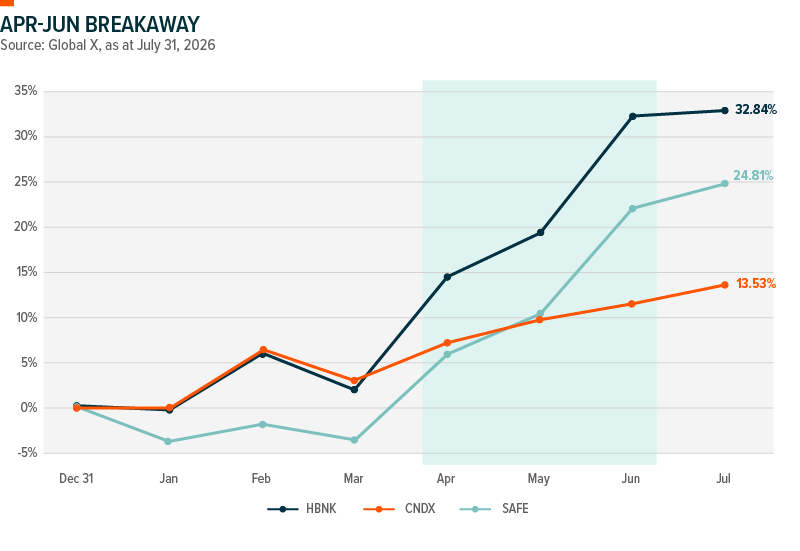
HBNK returned 32.84%, year to date, as of July 31, 2026, while SAFE gained 24.81%. The Global X S&P/TSX 60 Index ETF (CNDX) returned 13.53% over the same period. That left HBNK 19.31 percentage points ahead of large-cap Canada and SAFE 11.28 points ahead.
Today, Canada’s financial sector is the biggest sector represented within the S&P/TSX 60, at 42.6% of its market capitalization. Compare that to 17.7% for Energy and 11.8% for Materials, as of July 31, 2026. Put differently, financials are larger than both of Canada’s resource-focused sectors combined.
This spring was a decisive stretch. SAFE outperformed CNDX in five of the seven monthly periods from January through July. HBNK beat CNDX in three, but those three came consecutively from April through June, when the bank ETF gained 29.4% on a compounded basis. The pattern suggests the advance was not simply a one-month rebound.
Month-End Returns
Source: Global X Canada, as at July 31, 2026
| Month-End | HBNK | SAFE | CNDX |
| January | -0.37% | -3.81% | -0.19% |
| February | 6.43% | 2.05% | 6.58% |
| March | -3.81% | -1.77% | -3.10% |
| April | 12.11% | 9.72% | 4.24% |
| May | 4.36% | 4.13% | 2.14% |
| June | 10.77% | 10.71% | 1.64% |
| July | 0.49% | 2.33% | 1.78% |
| Annualized Performance (%) as at July 31, 2026 | YTD | 1 yr | 3 yr | Since Inception | Inception Date |
| Global X Equal Weight Canadian Banks Index ETF (HBNK) | 32.84 | 68.52 | 35.3 | 35.99 | 05-Jul-23 |
| Global X Equal Weight Canadian Insurance Index ETF (SAFE) | 24.81 | 41.97 | – | 27.67 | 06-Nov-24 |
| Global X S&P/TSX 60 Index ETF (CNDX) | 13.53 | 31.7 | – | 25.75 | 14-May-24 |
| S&P/TSX 60™ Index | 13.57 | 31.79 | 22.56 | 26.77 | 31-Dec-98 |
Source: Global X Canada, as at July 31, 2026
The indicated rates of return are the historical annual compounded total returns, including charges in unit value and reinvestment of all distributions, and do not take into account sales, redemption, distribution or optional charges, or income taxes payable by any securityholder that would have reduced returns. Additionally, index returns do note take into account management, operating, or trading expenses. The rates of return above are not indicative of future returns. Investment funds are not guaranteed, their values change frequently, and past performance may not be repeated. The indices are not directly investable. Only the returns for periods of one year or greater are annualized returns.
Canada is a Financial Sector Leader in 2026
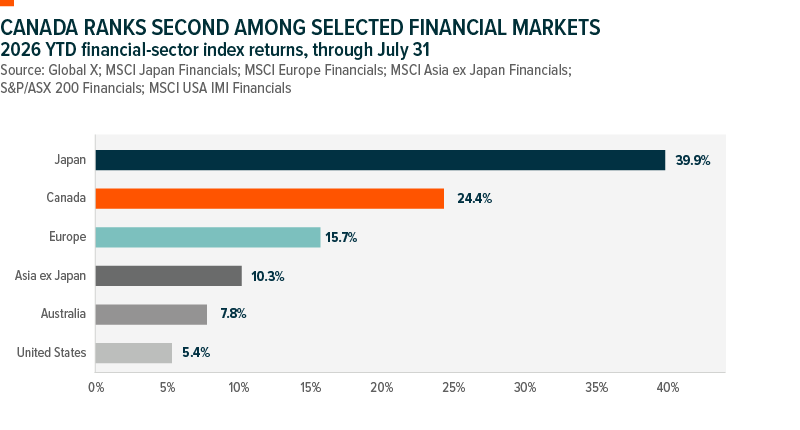
Canadian financials have also compared favourably internationally. Through July, the S&P/TSX Capped Financials Index returned 24.42%, ranking second among six selected markets. Canada trailed Japan at 39.88%, but finished ahead of Europe at 15.73%, Asia excluding Japan at 10.26%, Australia at 7.85% and the United States at 5.39%.
The comparison uses each index’s published base-currency return, so the experience of a Canadian investor holding foreign securities could differ as exchange rates move. Even with that qualification, the ranking makes the broader point clearly: Canada’s financial-sector rally has been notable on a global basis, not only relative to its domestic market.
Banks: earnings plus a substantial capital cushion
Fundamentals help explain the move. Royal Bank of Canada grew second-quarter net income by 25% year over year, while TD increased adjusted earnings per share by 21%. TD’s Canadian personal and commercial bank benefited from volume growth, wider margins and lower provisions for credit losses. Wealth management and capital-markets businesses add further diversification across the group.
The Canadian model also differs from the fragmented U.S. banking system. HBNK holds the Big Six banks at approximately equal weights, creating exposure to large, nationally diversified institutions operating under a common federal regulator. In June, the Office of the Superintendent of Financial Institutions (OSFI) reported an average Common Equity Tier 1 ratio of 13.5% for the Big Six, above its 11% supervisory expectation and equal to roughly $74 billion of excess capital capacity. OSFI’s international work also found that Canadian banks maintain materially more capital above binding requirements than global peers.
That buffer cannot eliminate a credit cycle, but it can help banks absorb losses, keep lending and invest through weaker conditions. With the Bank of Canada holding its policy rate at 2.25% in July and expecting growth to improve while inflation trends toward 2%, the macro backdrop may become less restrictive without returning immediately to ultra-low rates.
Insurers: Canadian companies with global engines
21%
Manulife Asia
core earnings
11%
Great-West
base earnings
145%
Sun Life
LICAT ratio
17%
Intact
operating ROE
SAFE offers a different source of financial-sector growth. As of July 31 2026, the ETF holds Great-West Lifeco, Sun Life, Manulife and Intact, on an equal weighted basis. These are Canadian-listed businesses, but their earnings and operations reach across North America, Europe and Asia.
Manulife provides the clearest example: Q2 2026 core earnings in Asia rose 21% year over year, and all three of its insurance new-business metrics grew at double-digit rates.
Great-West Lifeco increased base earnings by 11%, supported by retirement, wealth and capital-solutions businesses.
Sun Life grew underlying net income by about 11% and reported a 145% Life Insurance Capital Adequacy Test (LICAT) ratio – well above the 199% threshold set by OSFI.
Even with elevated catastrophe losses, Intact generated a 17% operating return on equity. At home, Canada’s life and health insurers hold more than $1 trillion in long-term investments, reinforcing their importance to the broader economy.
The durability case is therefore broader than a single market rally: strong bank capital, diversified fee businesses, disciplined underwriting and overseas growth all contribute. Risks remain – slower growth and credit losses for banks; claims inflation, catastrophes and market volatility for insurers. But the 2026 data show why Canadian financials can be viewed not simply as a large part of the index, but as a source of earnings strength and global reach.
Own the sector, not just a single stock
Rather than choosing which bank or insurer will lead next, HBNK and SAFE provide equal-weighted exposure across their respective groups. That reduces reliance on any one company, prevents the largest name from dominating and removes the need to build and rebalance the basket yourself – all through a single ETF. HBNK targets diversified Canadian banks and SAFE targets Canada’s largest insurers.
Explore HBNK | Explore SAFE
Performance figures are historical total returns through July 31, 2026. ETF returns are NAV total returns and assume reinvestment of distributions. Past performance may not be repeated. Holdings are subject to change. International comparisons show each financial sector’s return less its own home-market return; index currencies and return conventions vary by market.
Research sources
Bank resilience and outlook: OSFI capital decision | OSFI peer review | Bank of Canada
International indices and industry scale: MSCI Japan | MSCI Europe | MSCI USA | CLHIA
Commissions, management fees and expenses all may be associated with an investment in products (the “Global X Funds”) managed by Global X Investments Canada Inc. The Global X Funds are not guaranteed, their values change frequently and past performance may not be repeated. The prospectus contains important detailed information about the Global X Funds. Please read the relevant prospectus before investing.
Certain statements may constitute a forward-looking statement, including those identified by the expression “expect” and similar expressions (including grammatical variations thereof). The forward-looking statements are not historical facts but reflect the author’s current expectations regarding future results or events. These forward-looking statements are subject to a number of risks and uncertainties that could cause actual results or events to differ materially from current expectations. These and other factors should be considered carefully and readers should not place undue reliance on such forward-looking statements. These forward-looking statements are made as of the date hereof, and the authors do not undertake to update any forward-looking statement that is contained herein, whether as a result of new information, future events or otherwise, unless required by applicable law.
This communication is intended for informational purposes only and does not constitute an offer to sell or the solicitation of an offer to purchase investment products (the “Global X Funds”) managed by Global X Investments Canada Inc. and is not, and should not be construed as, investment, tax, legal or accounting advice, and should not be relied upon in that regard. Individuals should seek the advice of professionals, as appropriate, regarding any particular investment. Investors should consult their professional advisors prior to implementing any changes to their investment strategies. These investments may not be suitable to the circumstances of an investor.
All comments, opinions and views expressed are generally based on information available as of the date of publication and should not be considered as advice to purchase or to sell mentioned securities. Before making any investment decision, please consult your investment advisor or advisors.
Global X Investments Canada Inc. (“Global X”) is a wholly owned subsidiary of Mirae Asset Global Investments Co., Ltd. (“Mirae Asset”), the Korea-based asset management entity of Mirae Asset Financial Group. Global X is a corporation existing under the laws of Canada and is the manager, investment manager and trustee of the Global X Funds.
© 2026 Global X Investments Canada Inc. All Rights Reserved.
Published August 24, 2026