Key Takeaways
- Commodities are often treated as a secondary consideration in portfolio construction. But real assets ultimately power the global economy and sit at the centre of even the most future-facing technologies. With soaring energy markets and strong returns from precious metals in recent years, the case for reassessing commodity exposure has increased in light of recent market developments.
- From gold’s safe-haven appeal and silver’s industrial utility to copper’s role in Artificial Intelligence (AI) infrastructure, uranium’s nuclear comeback, and lithium’s battery demand, major commodities are being shaped by a distinct combination of structural supply deficits, geopolitical pressures, and long-term megatrends that extend well beyond traditional cyclical drivers.
- Global X has launched three new all-in-one commodity producer ETFs: the Global X All-In-One Commodity Producers Equity ETF (COMX) offers broad commodity-producer equity exposure; Global X All-In-One Commodity Producers Equity Covered Call ETF (CMCC) offers monthly covered call income, and the Global X Enhanced All-In-One Commodity Producers Equity Covered Call ETF (CMCL) offers enhanced semi-monthly distributions with approximately 125% leverage.
Commodities are the raw materials behind everyday products — from food and fuel to metals and electronics.
They fall into broad categories: agricultural goods like wheat and cotton, energy products like oil and natural gas, and metals like gold, silver, and aluminum. What makes commodities particularly valuable in a portfolio is their low correlation to stocks and bonds. Because they react differently to economic conditions than financial assets, they can help reduce overall portfolio volatility. They also tend to benefit from rising inflation, making them a potential hedge when prices accelerate — a characteristic few other asset classes can offer.
Commodities are often under-allocated in portfolios. But real assets – including silver and copper – are the building blocks of the global economy. With crude rising 70% since the start of the Iran conflict and gold climbing 66% in 2025 while silver rose by 160%, could this be an opportunity to reassess commodity exposure? This blog offers a snapshot of key commodities and introduces three new ways to access them.
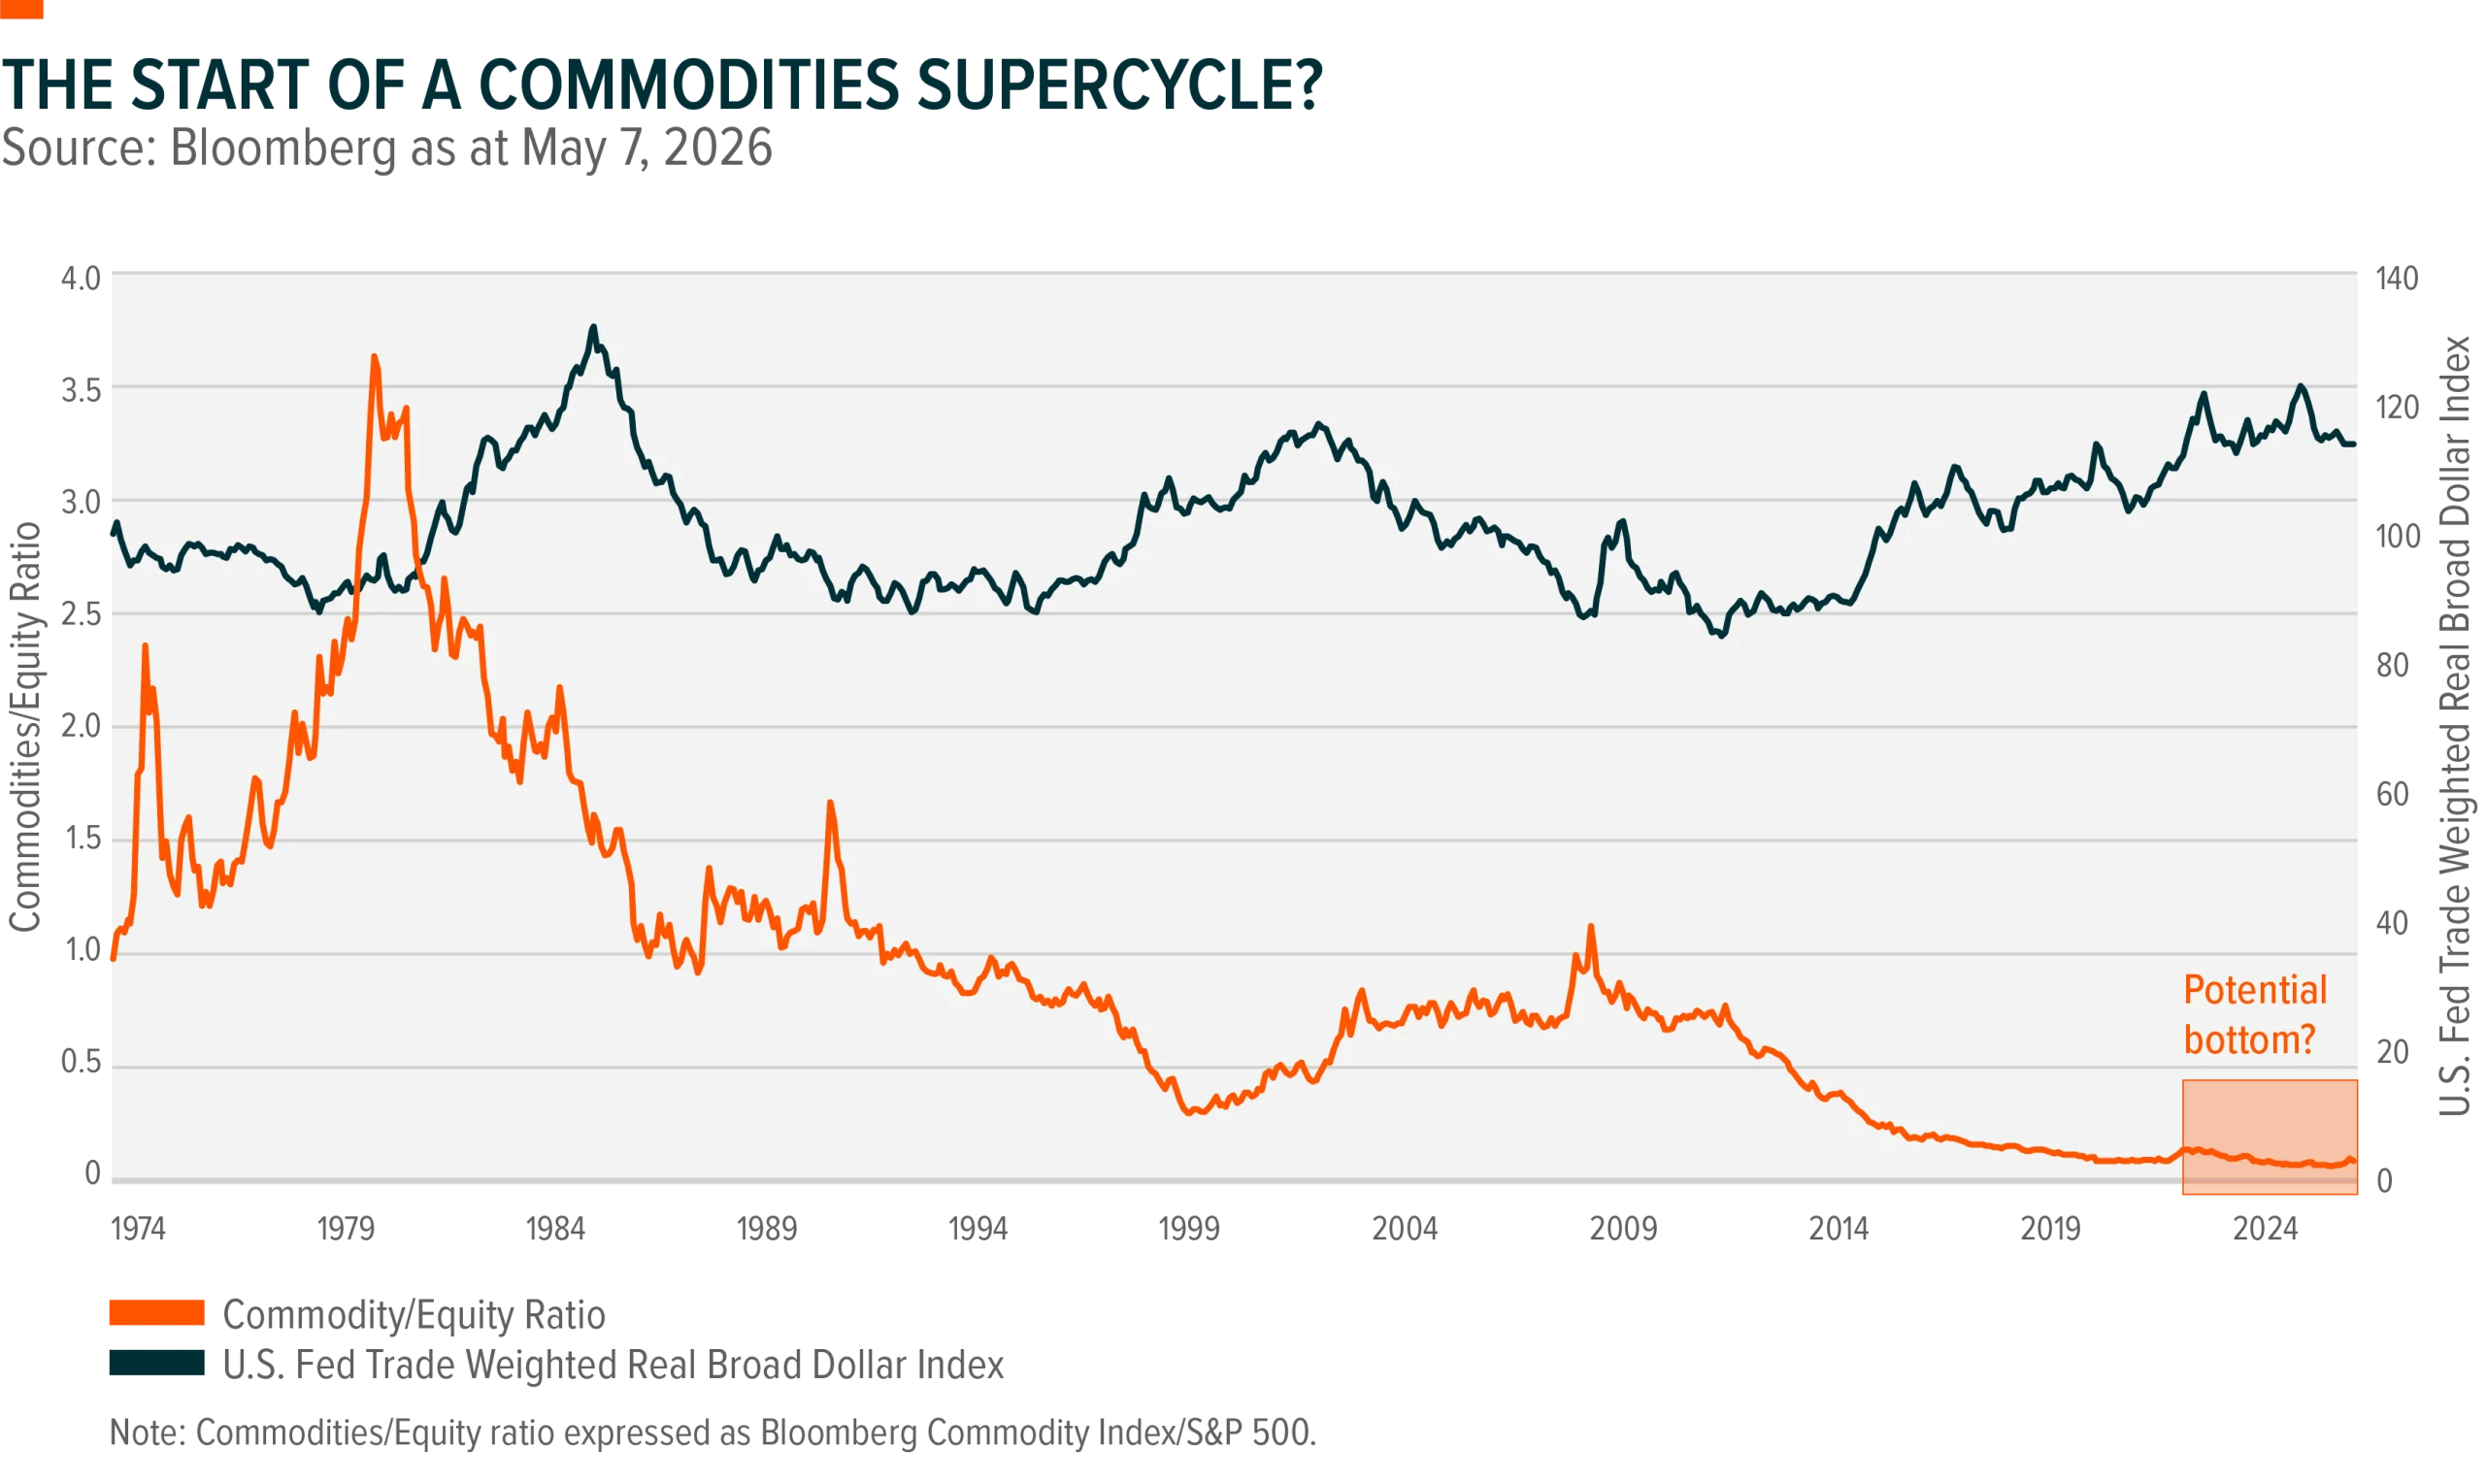
Demand Trends for a Commodities Supercycle
Based on the structural demand for electrification, critical minerals, and geopolitical pressures, some market participants are describing current trends as a potential “Commodities Supercycle”. Copper, silver, lithium, and uranium are experiencing strong demand across electric vehicles, renewable energy, and digital infrastructure.
Governments are increasingly treating critical minerals as strategic assets,1 prioritising supply chain security and energy independence — intensifying investment in materials tied to electrification, defence, and advanced infrastructure, and creating structural supply constraints that support higher prices.
Geopolitical tensions further reinforce the strategic importance of commodities, making an understanding of commodity-specific dynamics essential when evaluating opportunities in today’s evolving market.

“Investors are focused on other parts of the market, despite the shortages that are developing. That will change at some point. It is possible that a generational investment opportunity could be developing,” says Global X Research Analyst Brooke Thackray.
A Simplified Way to Access Commodities
For the average investor, gaining commodity exposure can appear complex, often requiring a detailed understanding of macro conditions and global supply and demand dynamics. Commodity miner ETFs offer a more accessible route — providing exposure to a commodity through the companies that produce it, rather than through physical holdings or futures contracts. This structure can create operational leverage to rising commodity prices, meaning miners may outperform the metal during strong bull markets, while ETFs can help mitigate single-stock risk through broad diversification.
Global X has launched three new all-in-one commodity producer ETFs, offering diversified exposure across energy, metals, and mining in a single allocation.
Global X All-In-One Commodity Producers Equity ETF (COMX)
COMX seeks long-term capital growth by investing in ETFs that provide exposure to a broad range of commodity producers globally, across energy, metals, and mining. COMX seeks to maintain a long-term strategic asset allocation of approximately 100% equity securities under normal market conditions.
CMCC seeks exposure to a broad range of global commodity producers, alongside at least monthly distributions of dividend income and call option premiums. To mitigate downside risk and generate premiums, CMCC employs a dynamic covered call strategy, generally writing call options on up to approximately 50% of the portfolio’s value.
Note: Covered call writing can limit the upside potential of the underlying security.
CMCL seeks exposure to a broad range of global commodity producers alongside high distributions of dividend income and call option premiums. In addition to a covered call strategy on up to approximately 50% of portfolio assets, CMCL employs leverage through cash borrowing, generally maintaining a leverage ratio of approximately 125% which may increase both income potential and investment risk.
Here is an overview of the commodities included in these ETFs.
Gold
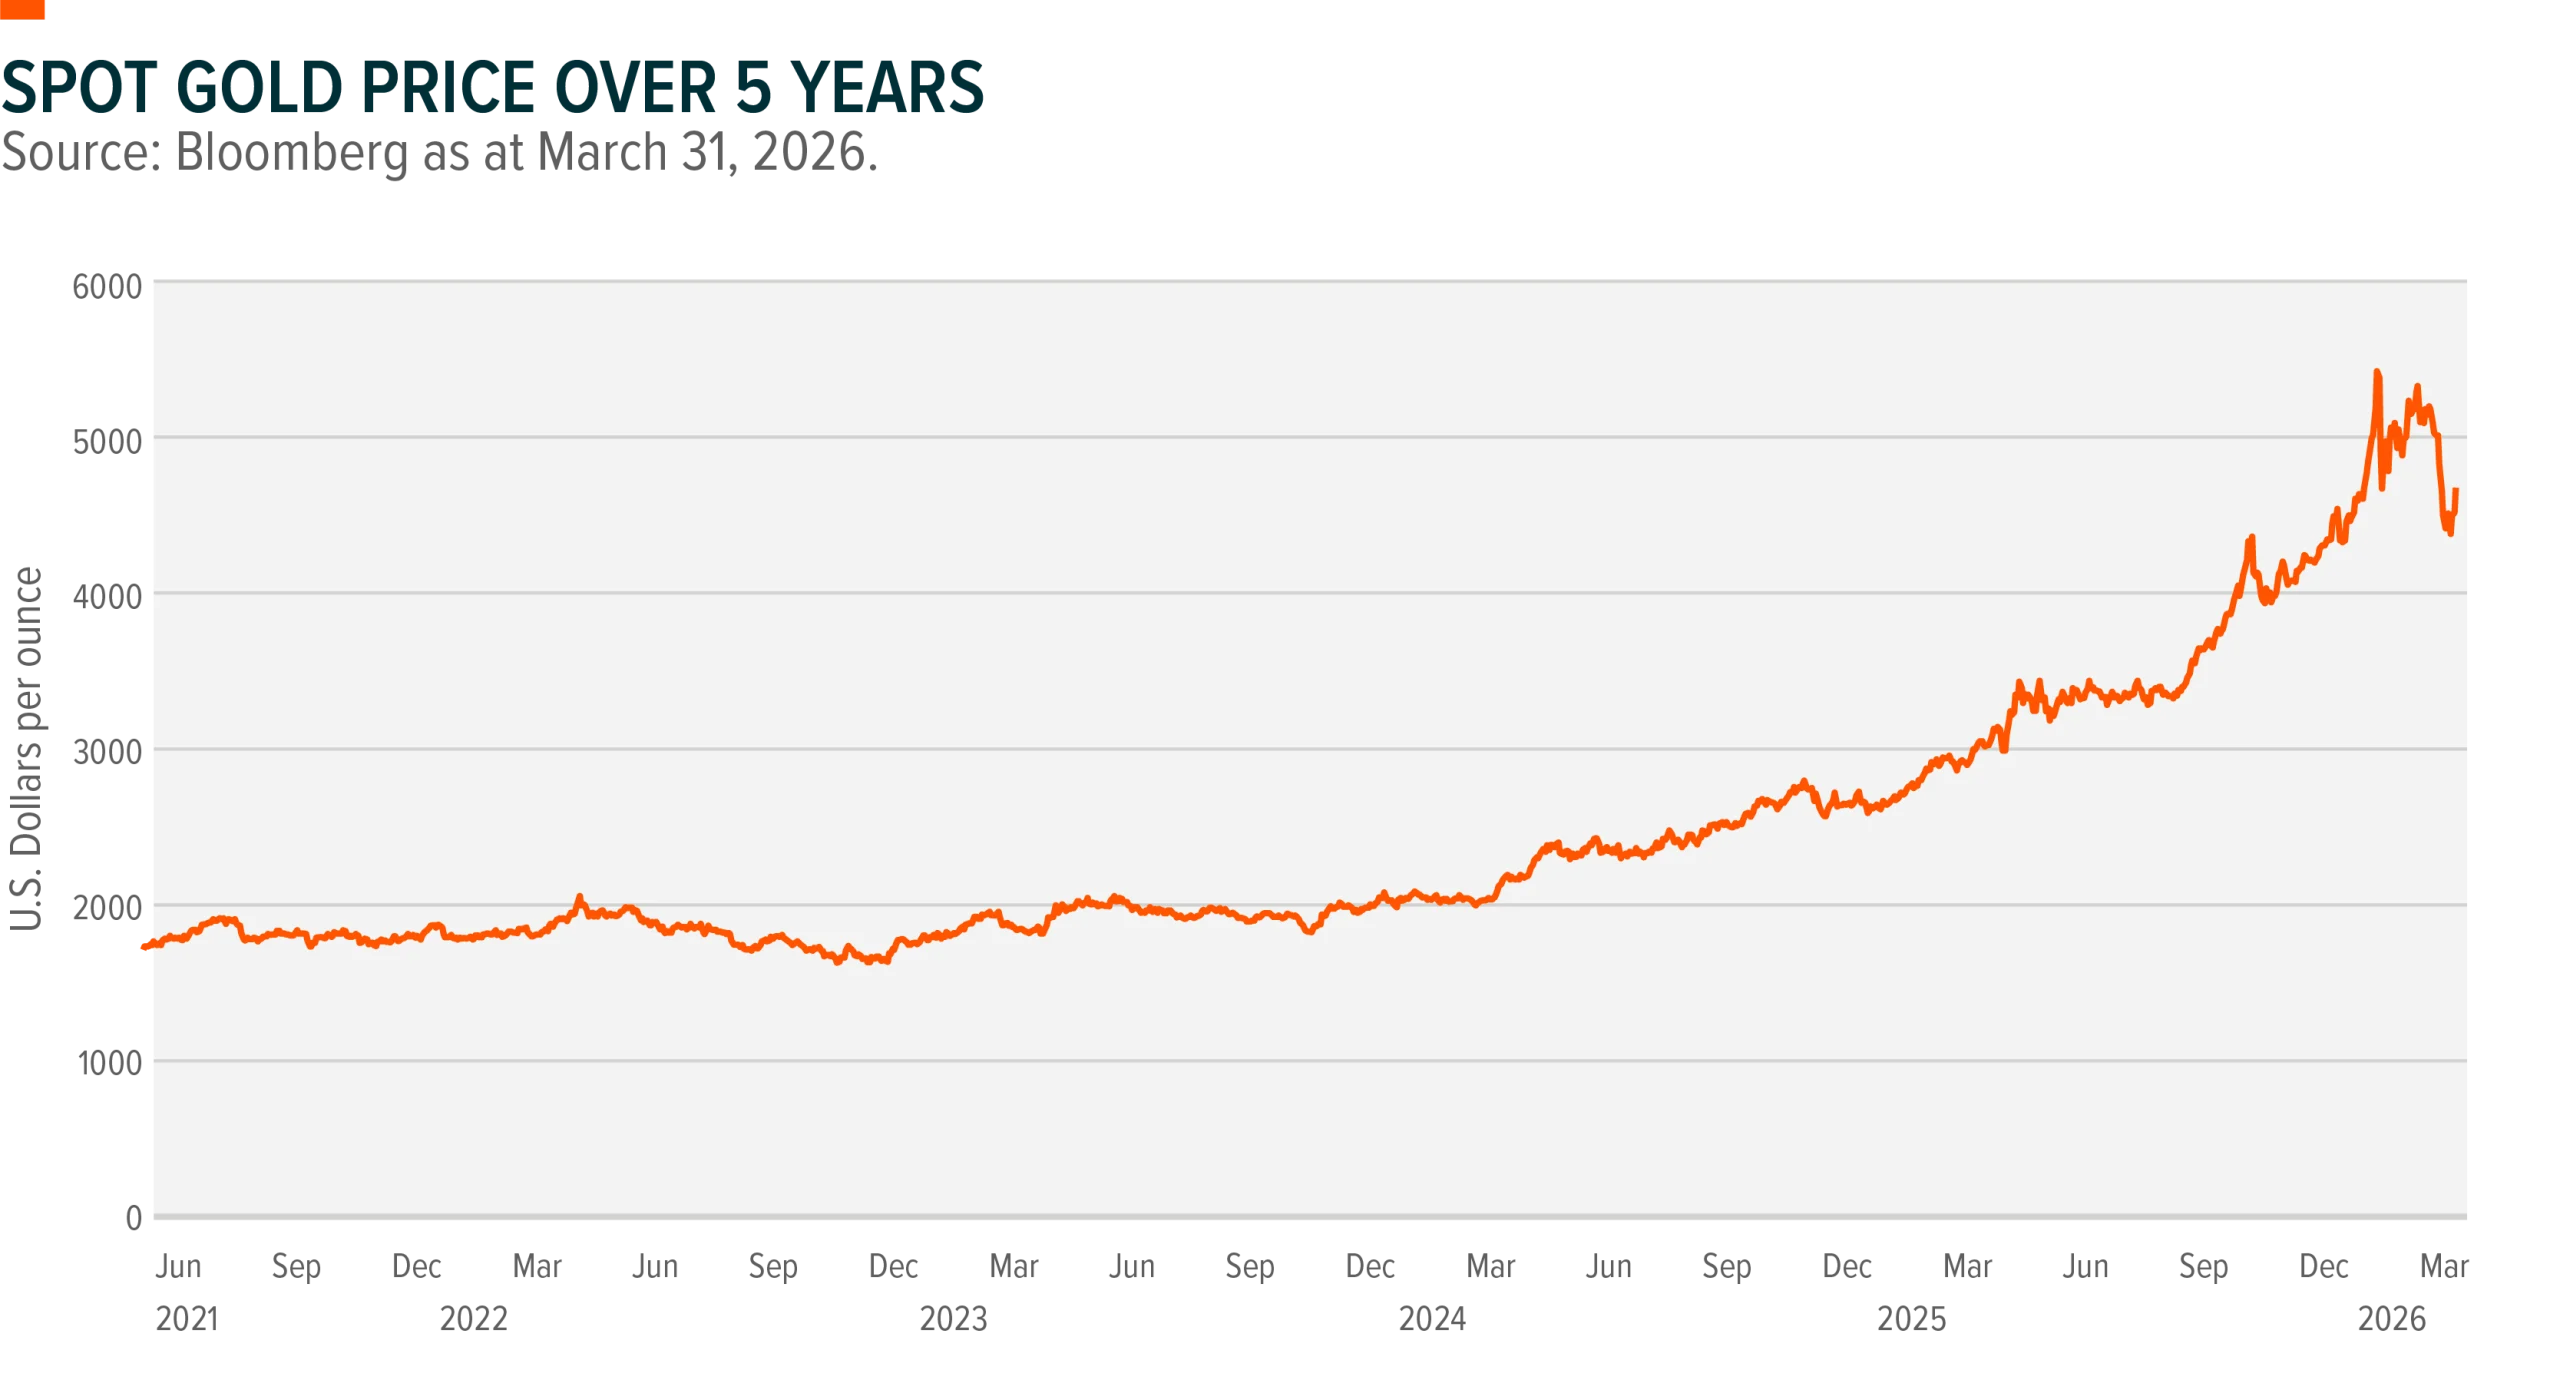
Gold has historically served as a store of value during market turbulence, and investors have renewed focus on those characteristics amid ongoing geopolitical uncertainty. Gold has hit fresh record highs in early 2026, extending strong gains from the prior year, as investors respond to renewed geopolitical tensions and shifting U.S. policy.
Steady demand from central banks has been a major support for gold prices.
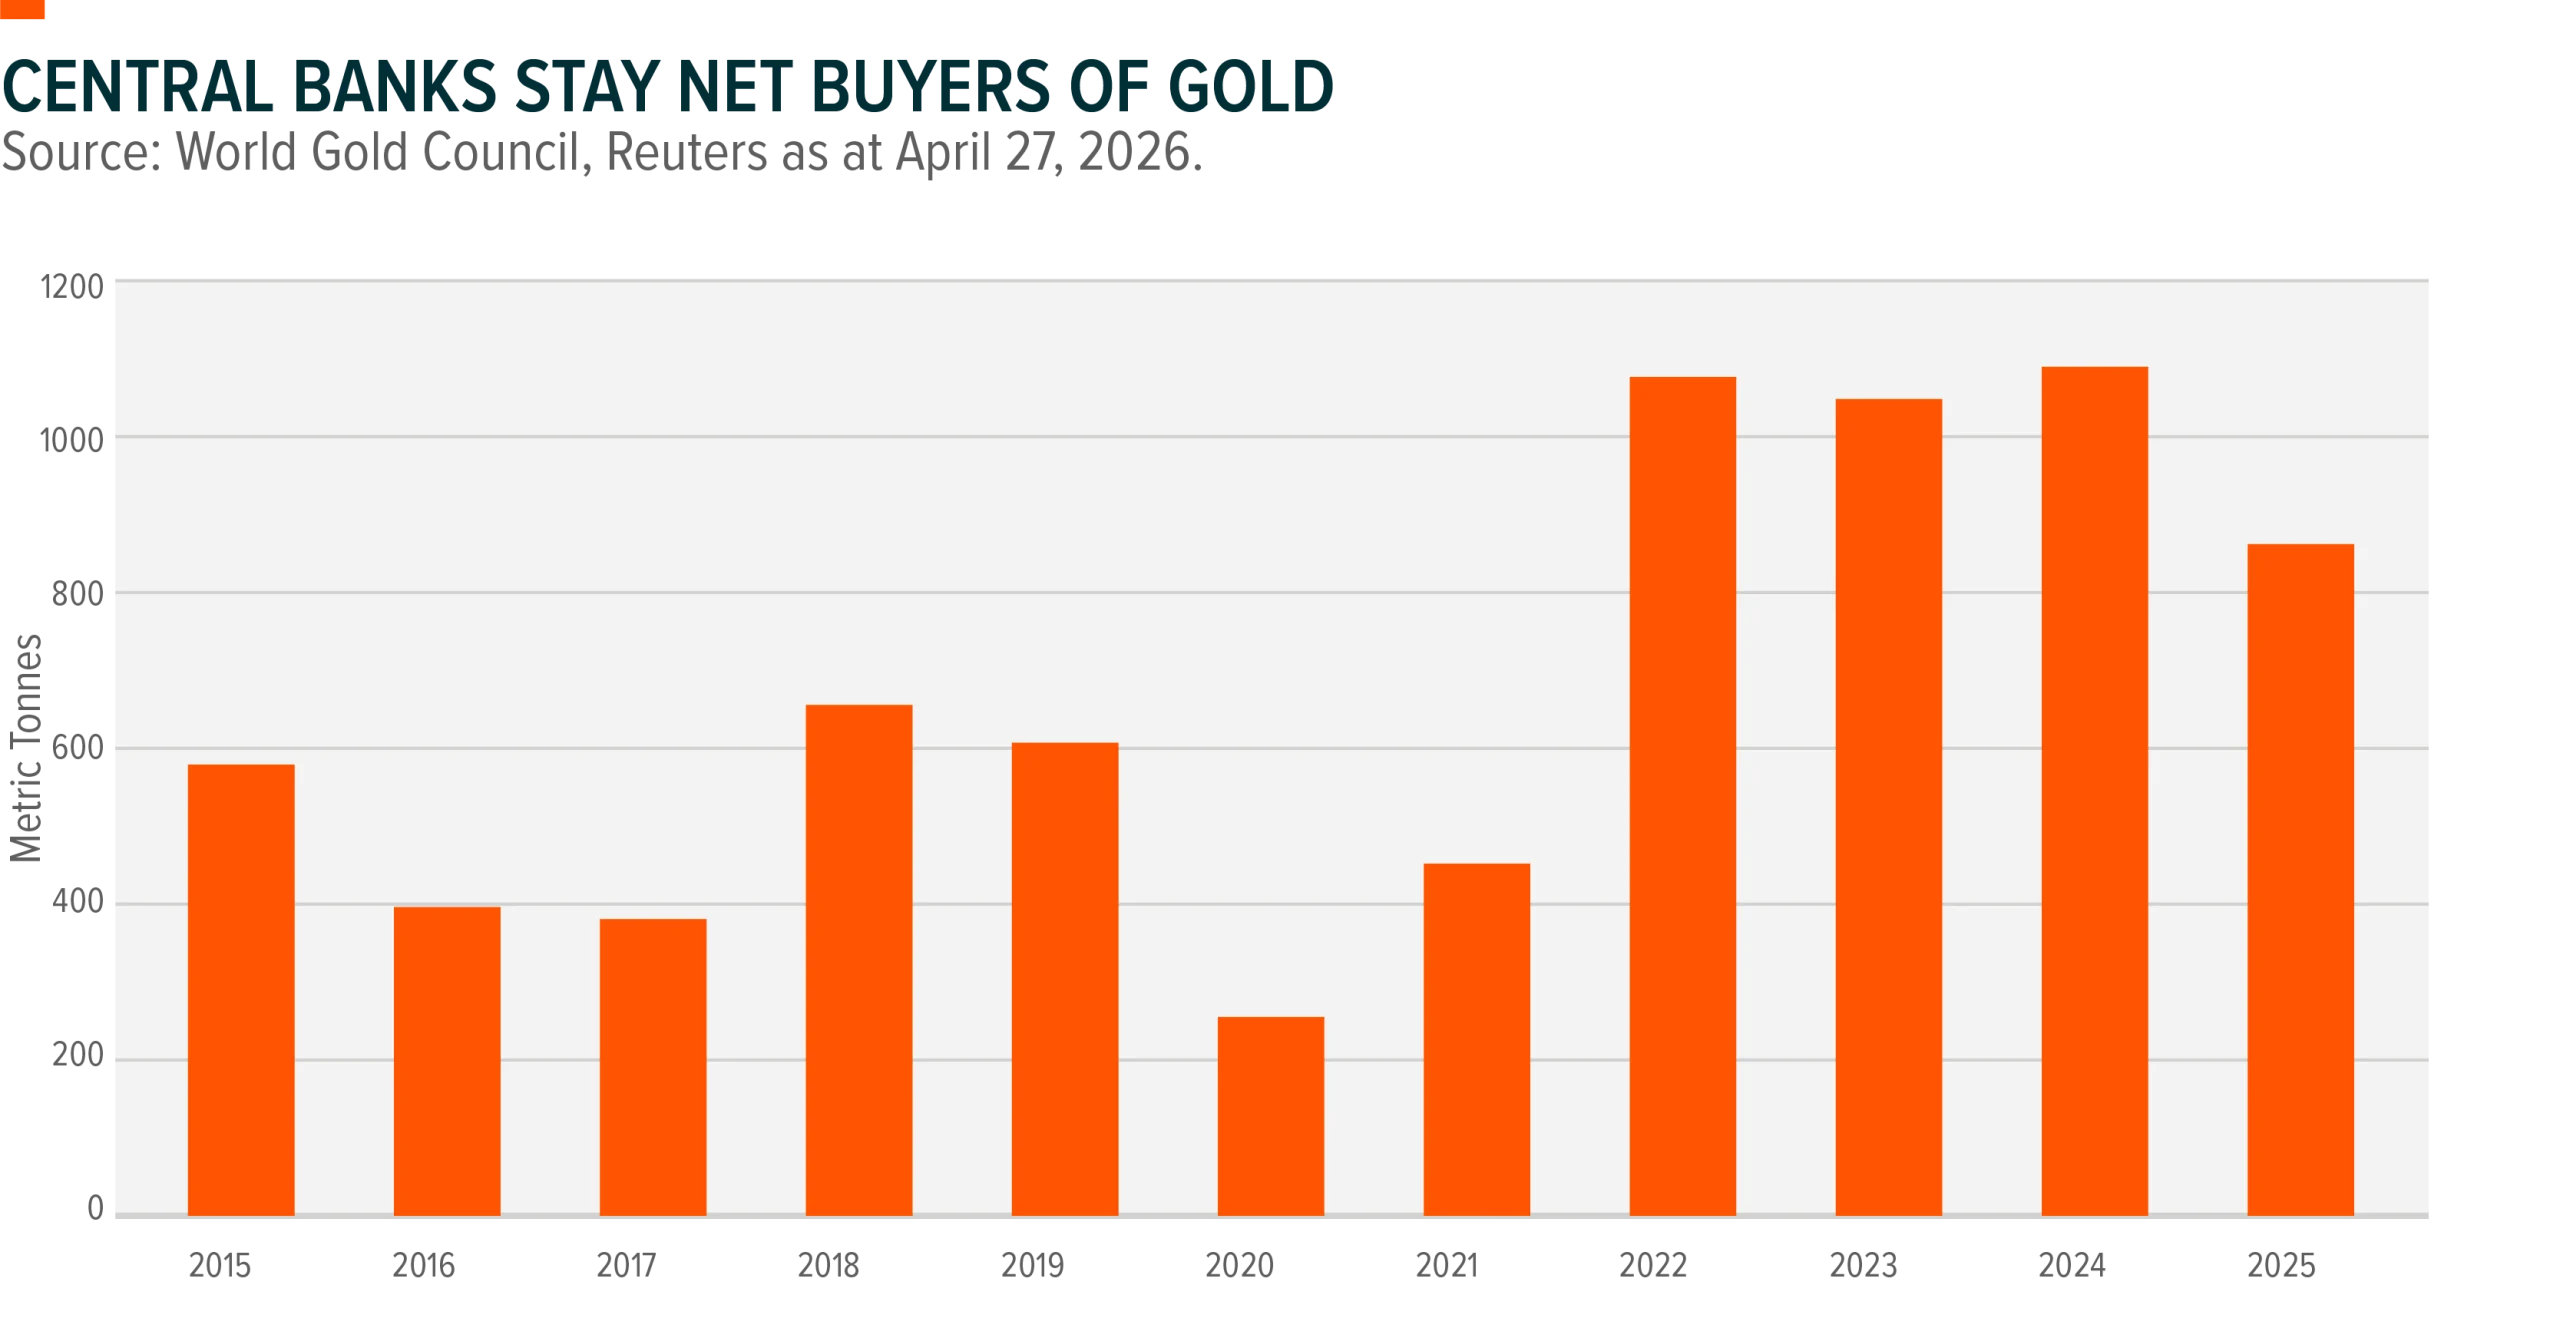
For example: China has been buying bullion for 17 months straight. At the end of March 2026, China had 74.38 million ounces of gold – worth US$342.76 billion.2
Gold also acts as a hedge against something investors worry about: currency debasement. When governments increase the money supply to stimulate growth, especially rapidly, the value of their currency tends to fall.
Gold has historically served as a store of value during market turbulence. Its physical nature can offer a sense of stability when risk sentiment turns. However, the recent Iran conflict may have challenged gold’s “safe haven” status. Gold has come off its recent all-time highs due to inflation and global growth concerns.
“Gold is now in a consolidation range. Gold tends to rally, consolidate and then rally again. It is likely that at some point in the future, gold will once again rally, but it is difficult to determine when this could happen,” Thackray says.
Silver
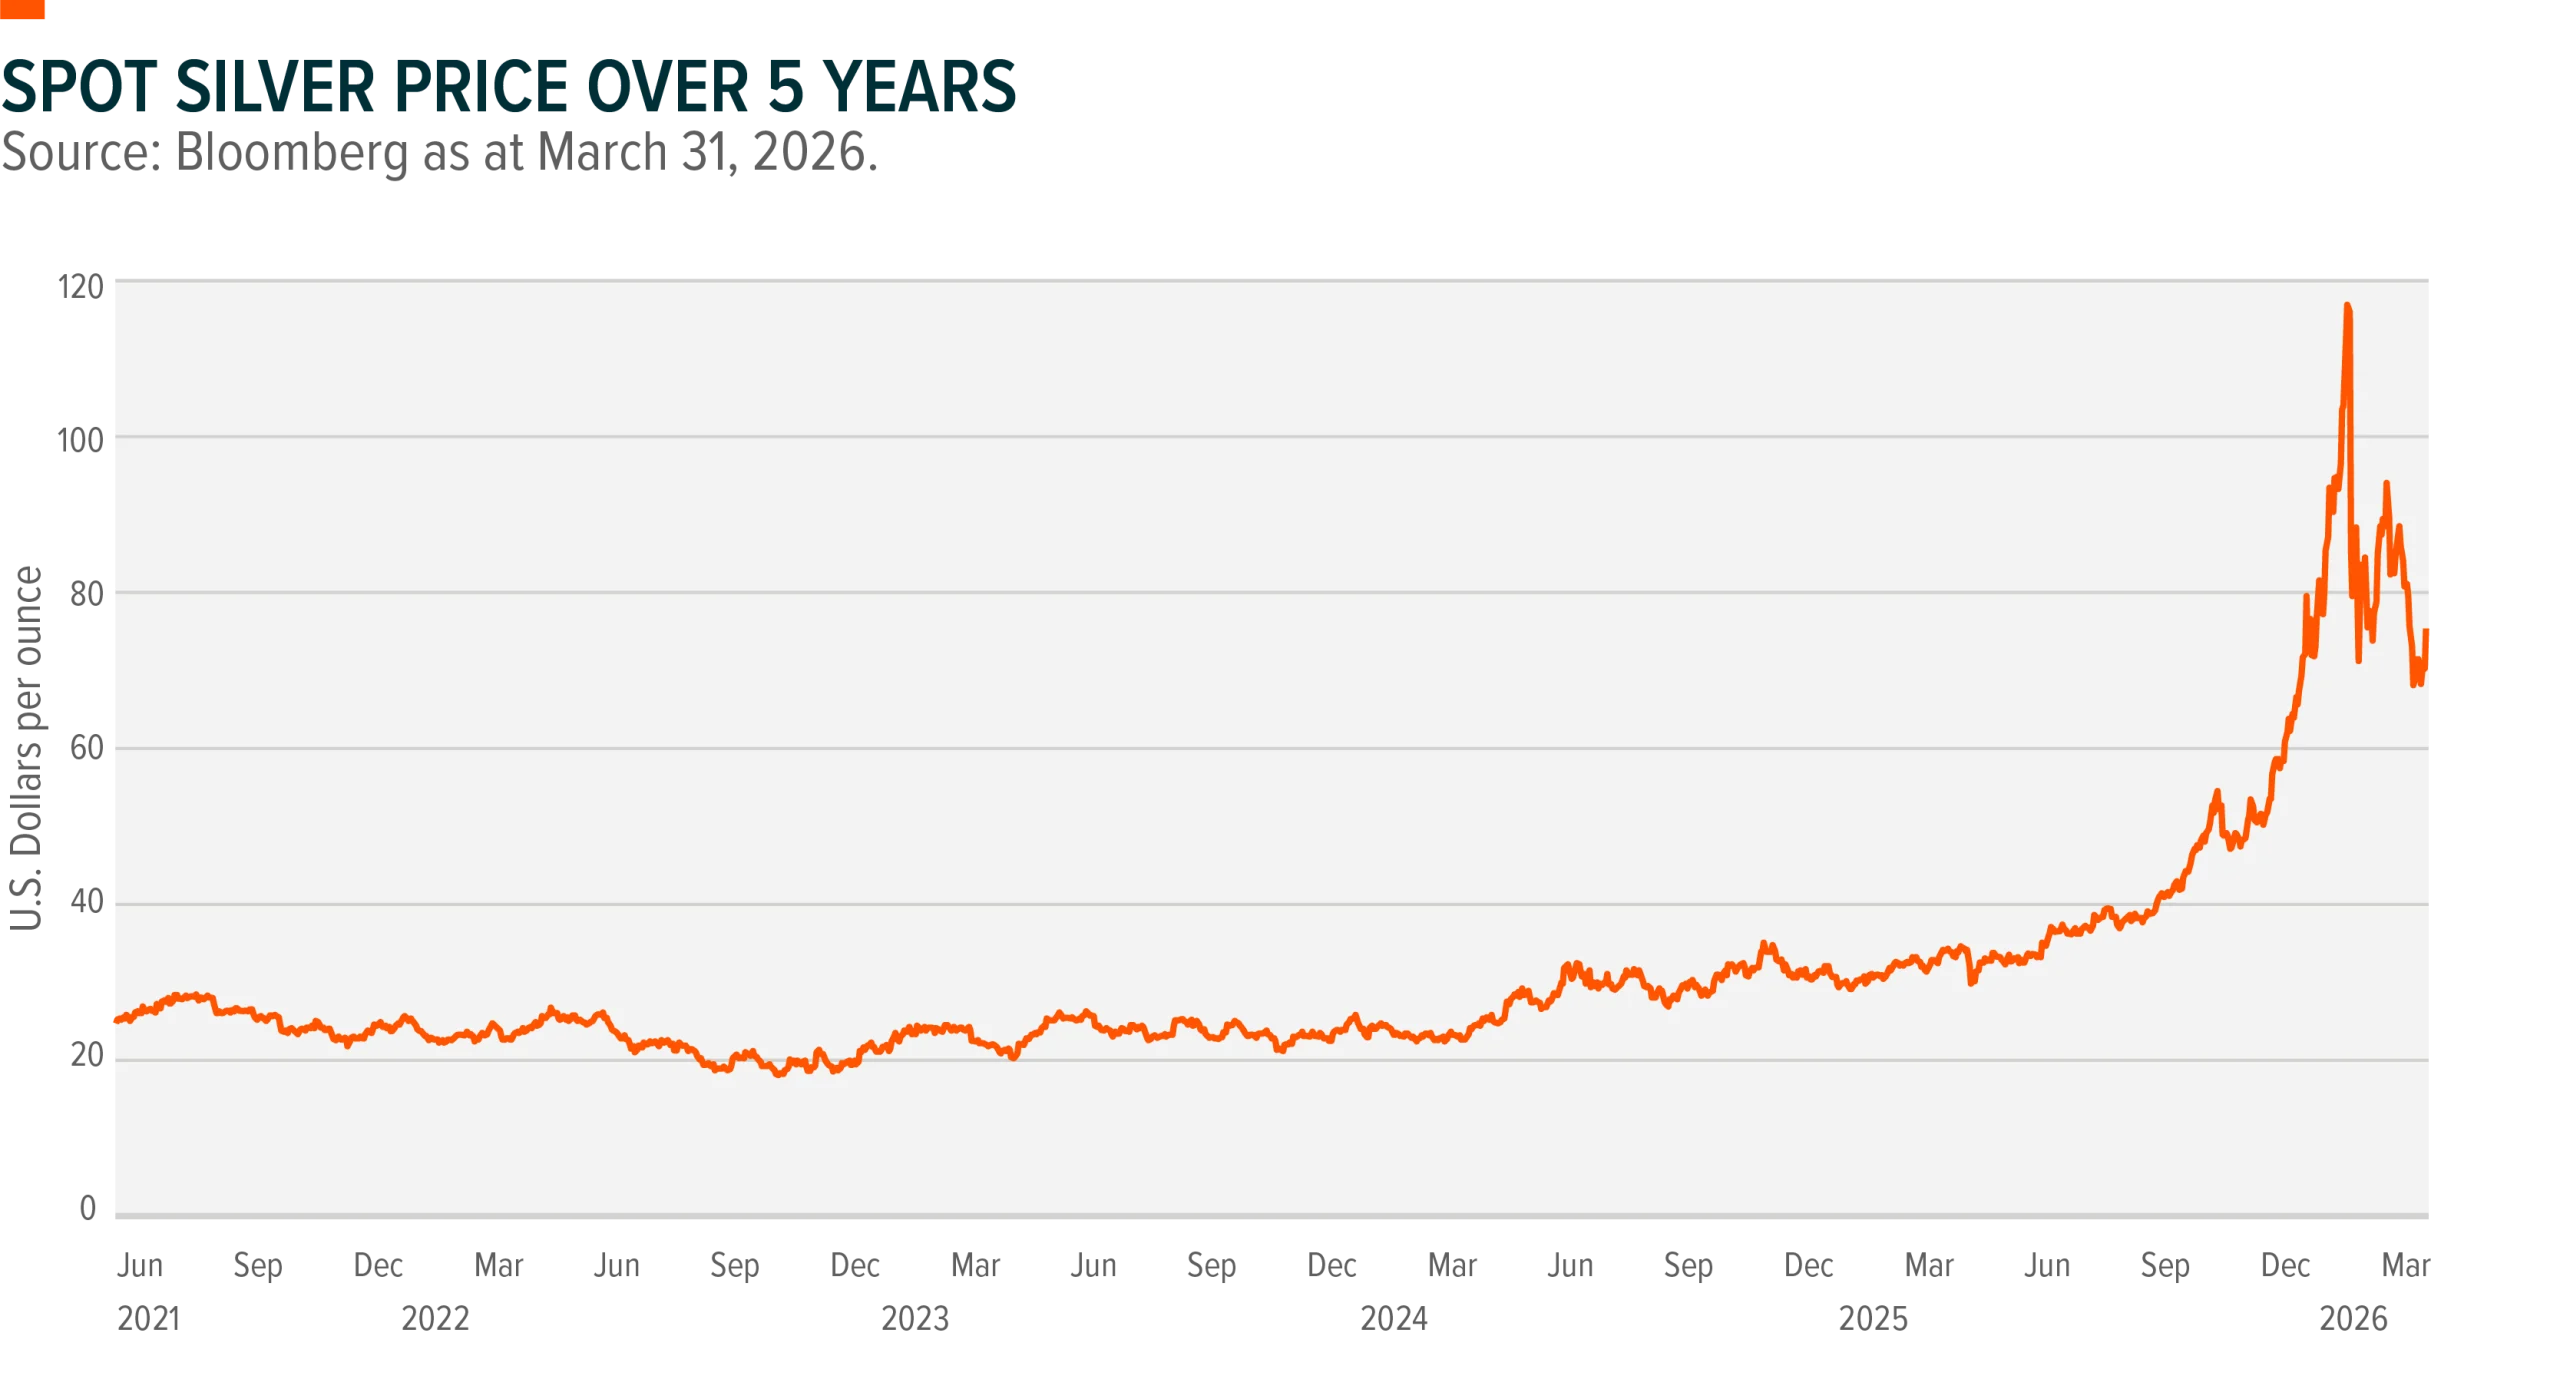
Silver is not just a precious metal; it has industrial uses too. Thanks to its conductive properties, it is used in electronics and solar panels, in electric vehicles and silver even has antimicrobial properties. While both gold and silver are classified as precious metals, silver stands out for its industrial utility — which accounts for 58% of annual demand.3
In contrast, only about 6% of gold demand is industrial.4 As a result, silver prices are influenced by both safe-haven demand and trends in industrial activity, giving it a more diversified demand profile than gold.
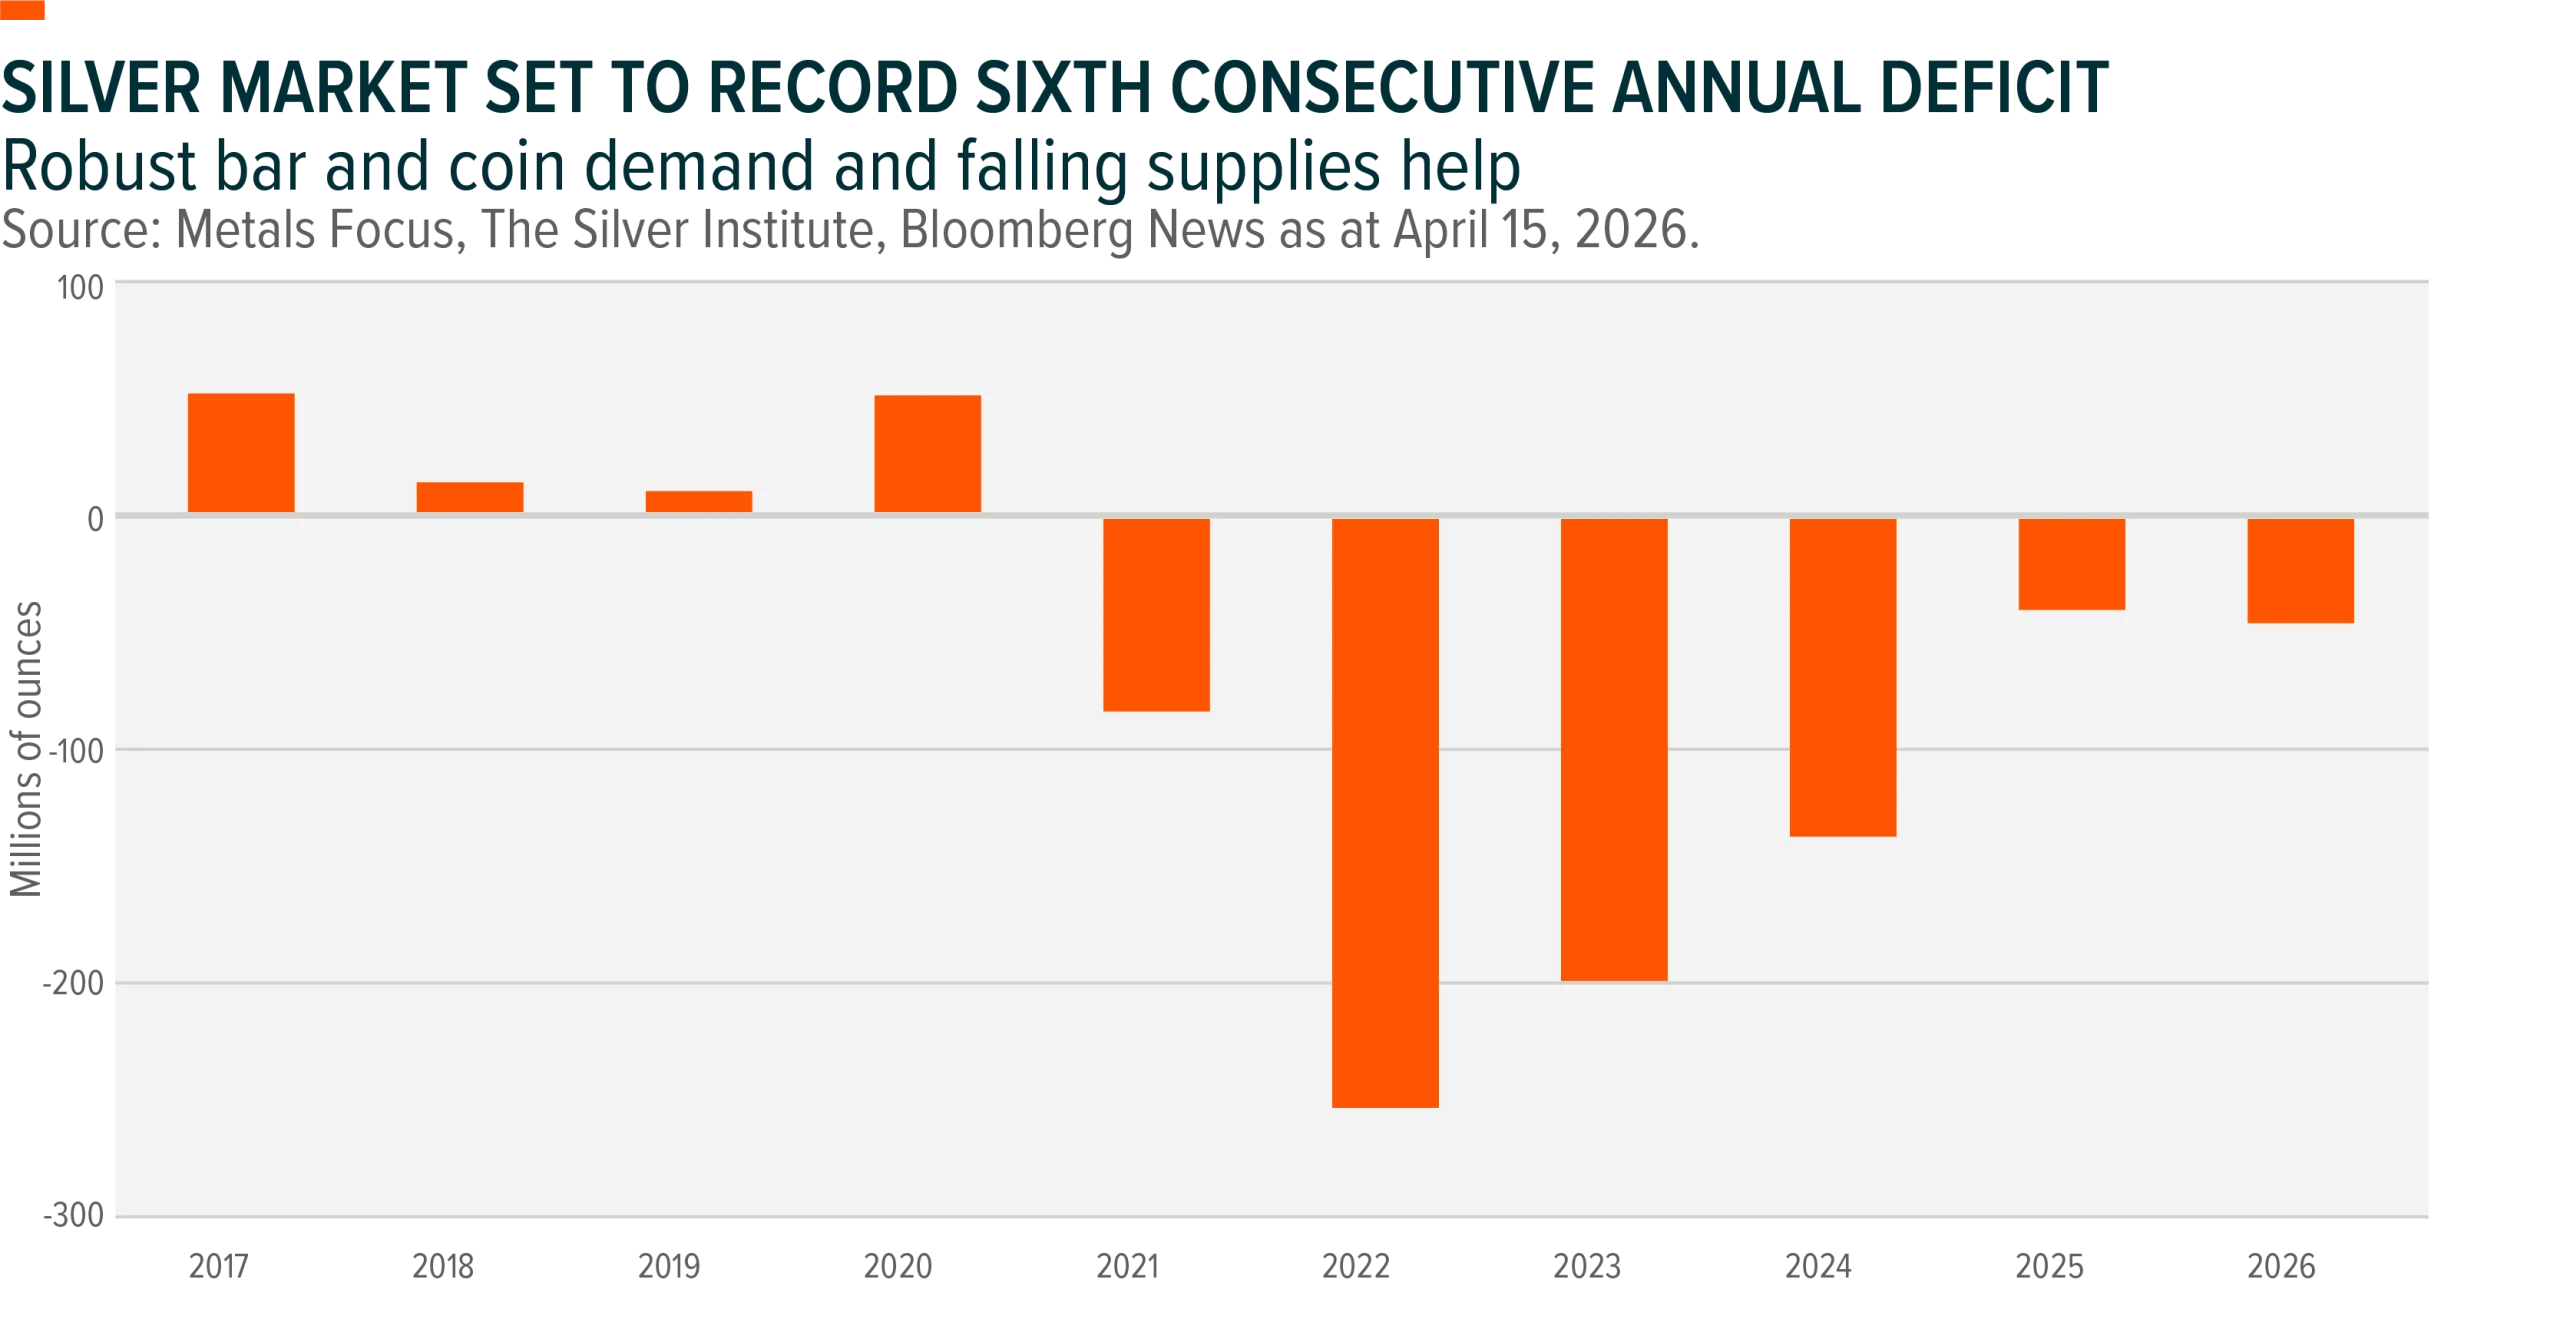
The silver market has experienced periods where demand exceeded supply. The global silver market is expected to remain in a deficit amid robust demand for bars and coins but declining supplies. The 2026 deficit is projected to widen by 15%to 46.3 million ounces.5
Total supply is expected to fall by 2% in 2026 due to a slight drop in mining output and reduced hedging activity amongst producers. A 7% rise in silver recycling may help blunt those losses.
Another example of demand: China is the world’s biggest silver consumer6 and imports of silver hit an all-time high in March on the back of retail demand and from the nation’s solar industry. In March 2026, China imported around 836 tons compared with a 10-year seasonal average of about 306 tons.
So how do investors evaluate the value of silver? The gold-silver ratio – which measures how many ounces of silver equal one ounce of gold – is a relative valuation metric used to guide buy or sell decisions between the two metals.
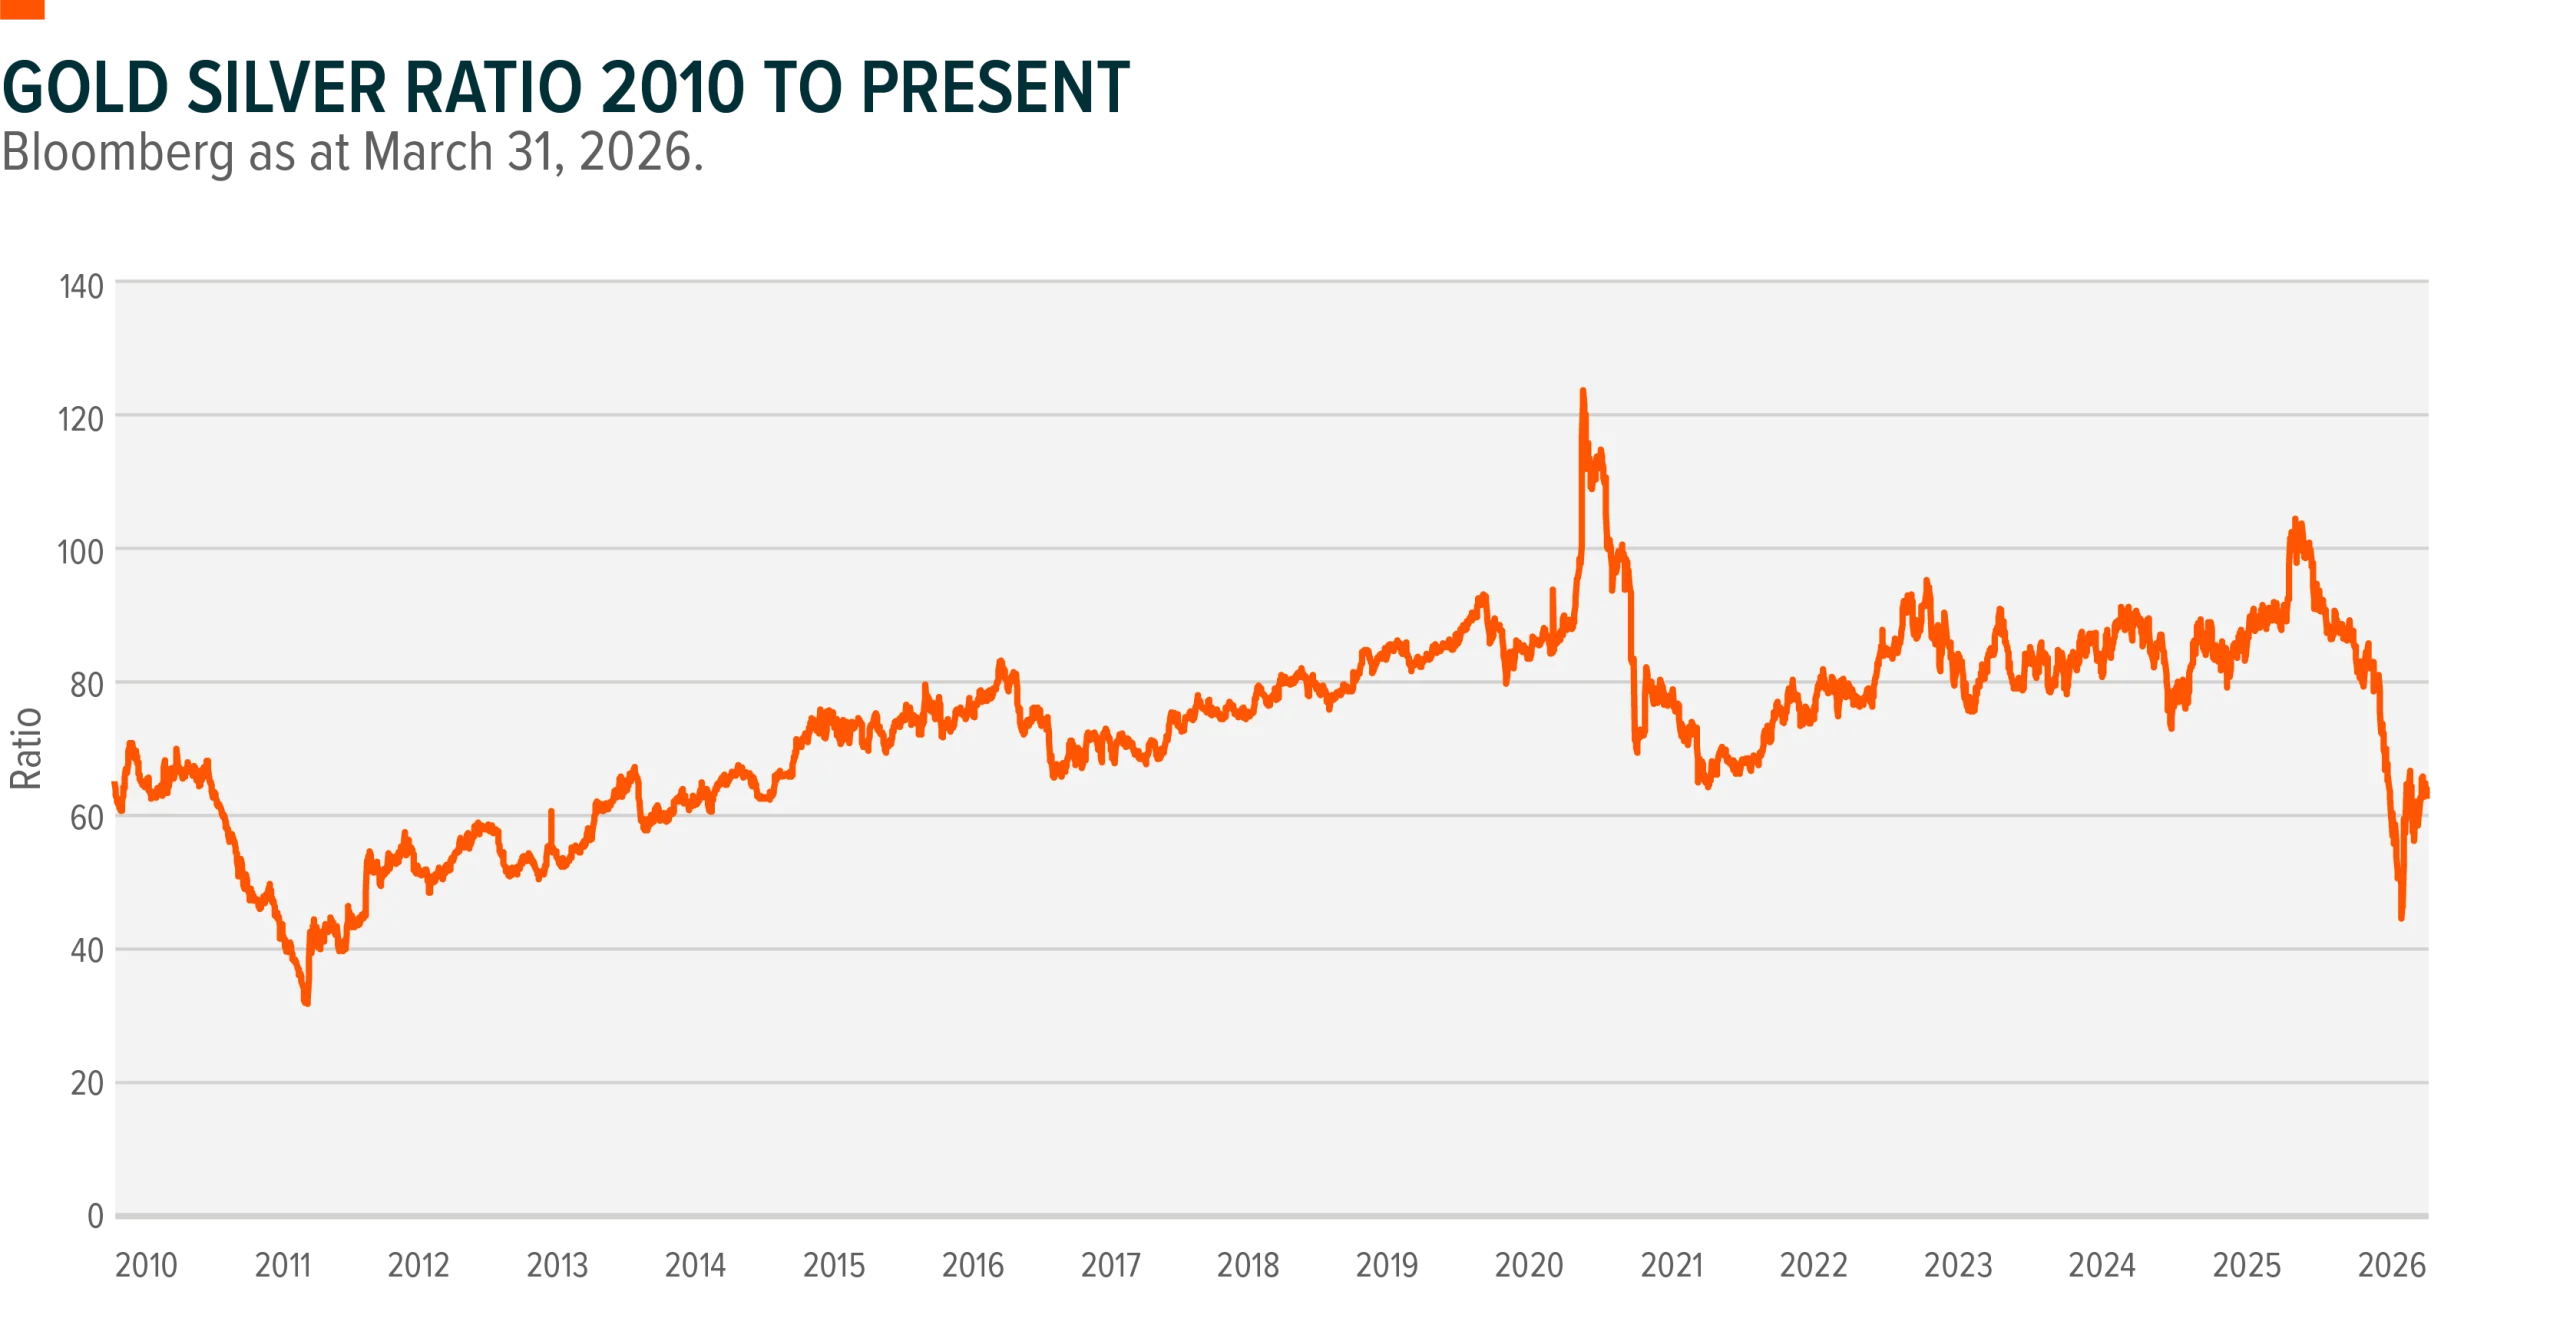
Historically, the ratio has averaged approximately 65 over the last 30 years. But with recent market strength, the ratio has fallen below 50, a level last seen in 2012.7
Since the start of the year, silver declined below $80.00 but has since shown resilience, forming technical price support.
“Given the size of the expected shortages in silver and that it is not a particularly large investment market, when investors and institutions start to increase their positions, the price of silver could move rapidly higher,” Thackray says.
Copper
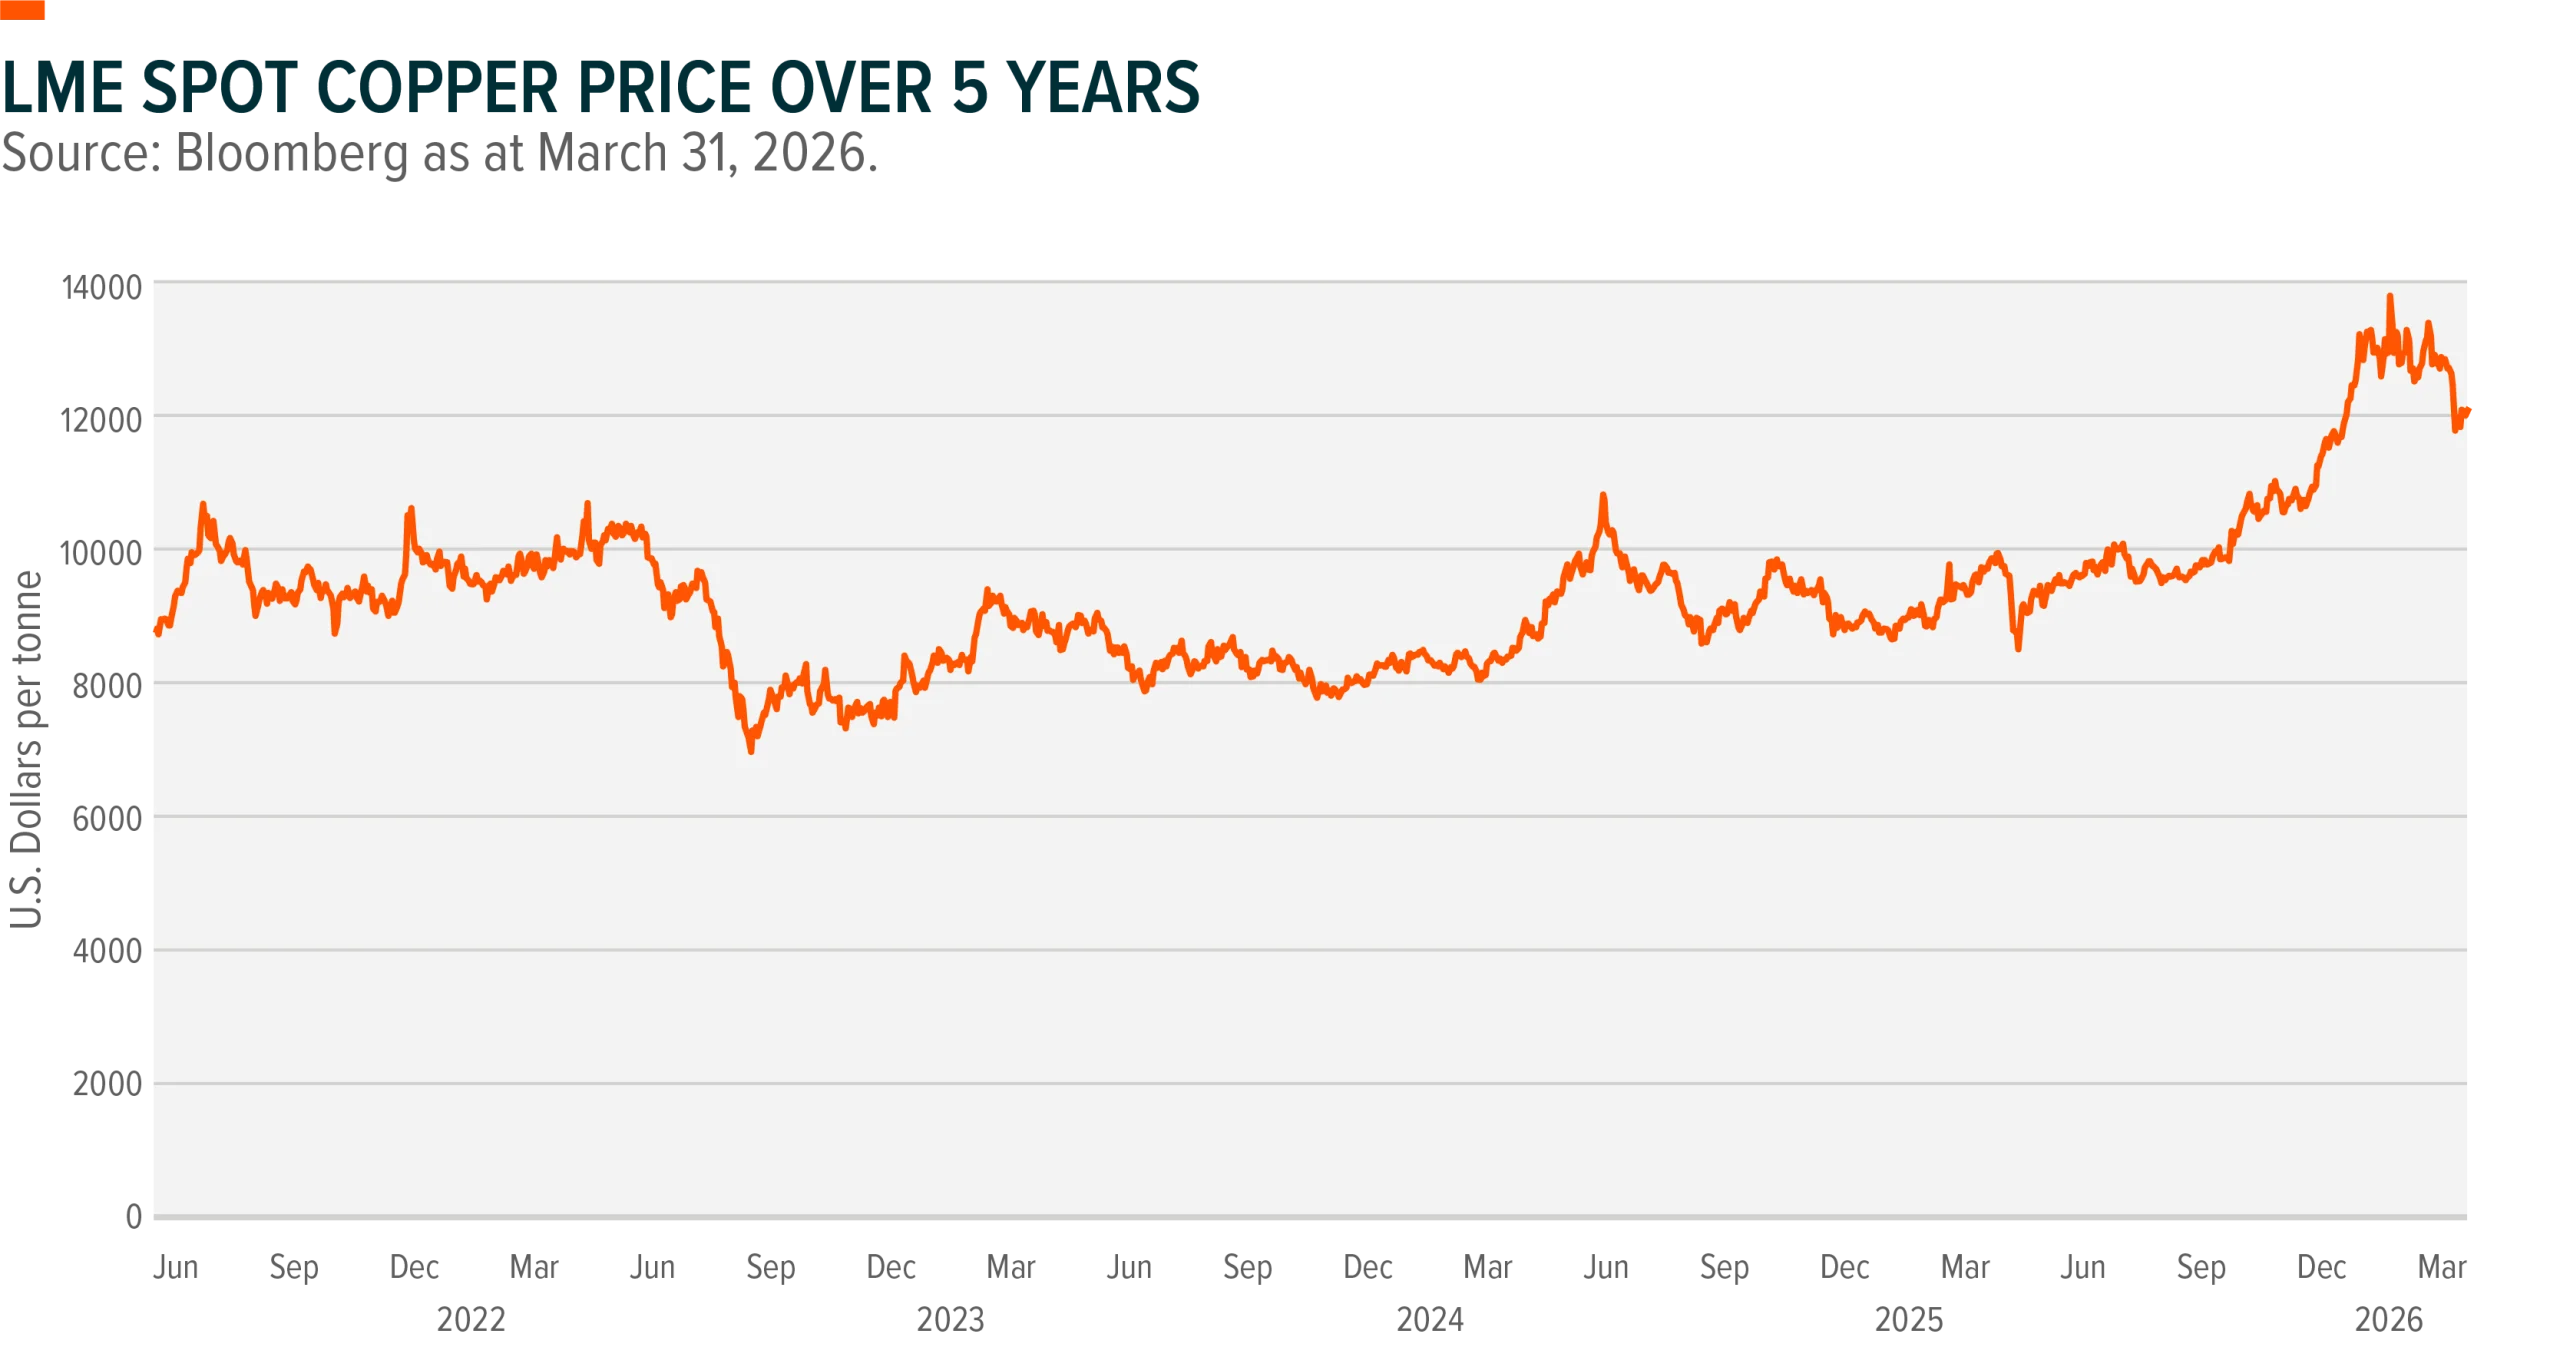
Copper is a metal at the meeting point of three themes: electrification, clean energy, and Artificial Intelligence (AI) infrastructure. With demand accelerating and supply increasingly constrained, price volatility has returned.
A key driver of near-term copper demand is the AI boom, which has driven a profound shift in computing, comparable to the internet or mobile revolutions. Building on digital connectivity and data, AI automates and enhances decision-making processes and has been used as a source of media and content generation.
Rapid growth in cloud computing and AI is fuelling sustained demand for data centre capacity as hyperscalers and corporations expand digital infrastructure. This infrastructure requires significant power. The U.S. alone will need just over 100 gigawatts of power for data centres by 2035.8 That’s the energy equivalent of adding 20 New York Cities.
On the demand side, expected copper output from mines is forecast to fall short of primary supply requirements.
Copper’s consumption is often used as a bellwether for global economic activity, earning it the nickname of “Doctor Copper”, as increases in copper usage typically correspond to periods of global economic expansion.
Three-quarters of copper’s use comes from power transmission and generation, and its use in electrical and telecommunications wiring and in electronic products.9
Renewable energy systems need copper to generate, transmit and store electricity.
Copper is also an essential component in electric vehicles, which can use up to four times the amount of copper that can be found in a conventional internal combustion engine.10
Copper’s strategic importance was further highlighted as it joined the U.S. government’s list of critical metals vital to the U.S. economy and national security that face potential risks from disrupted supply chains.
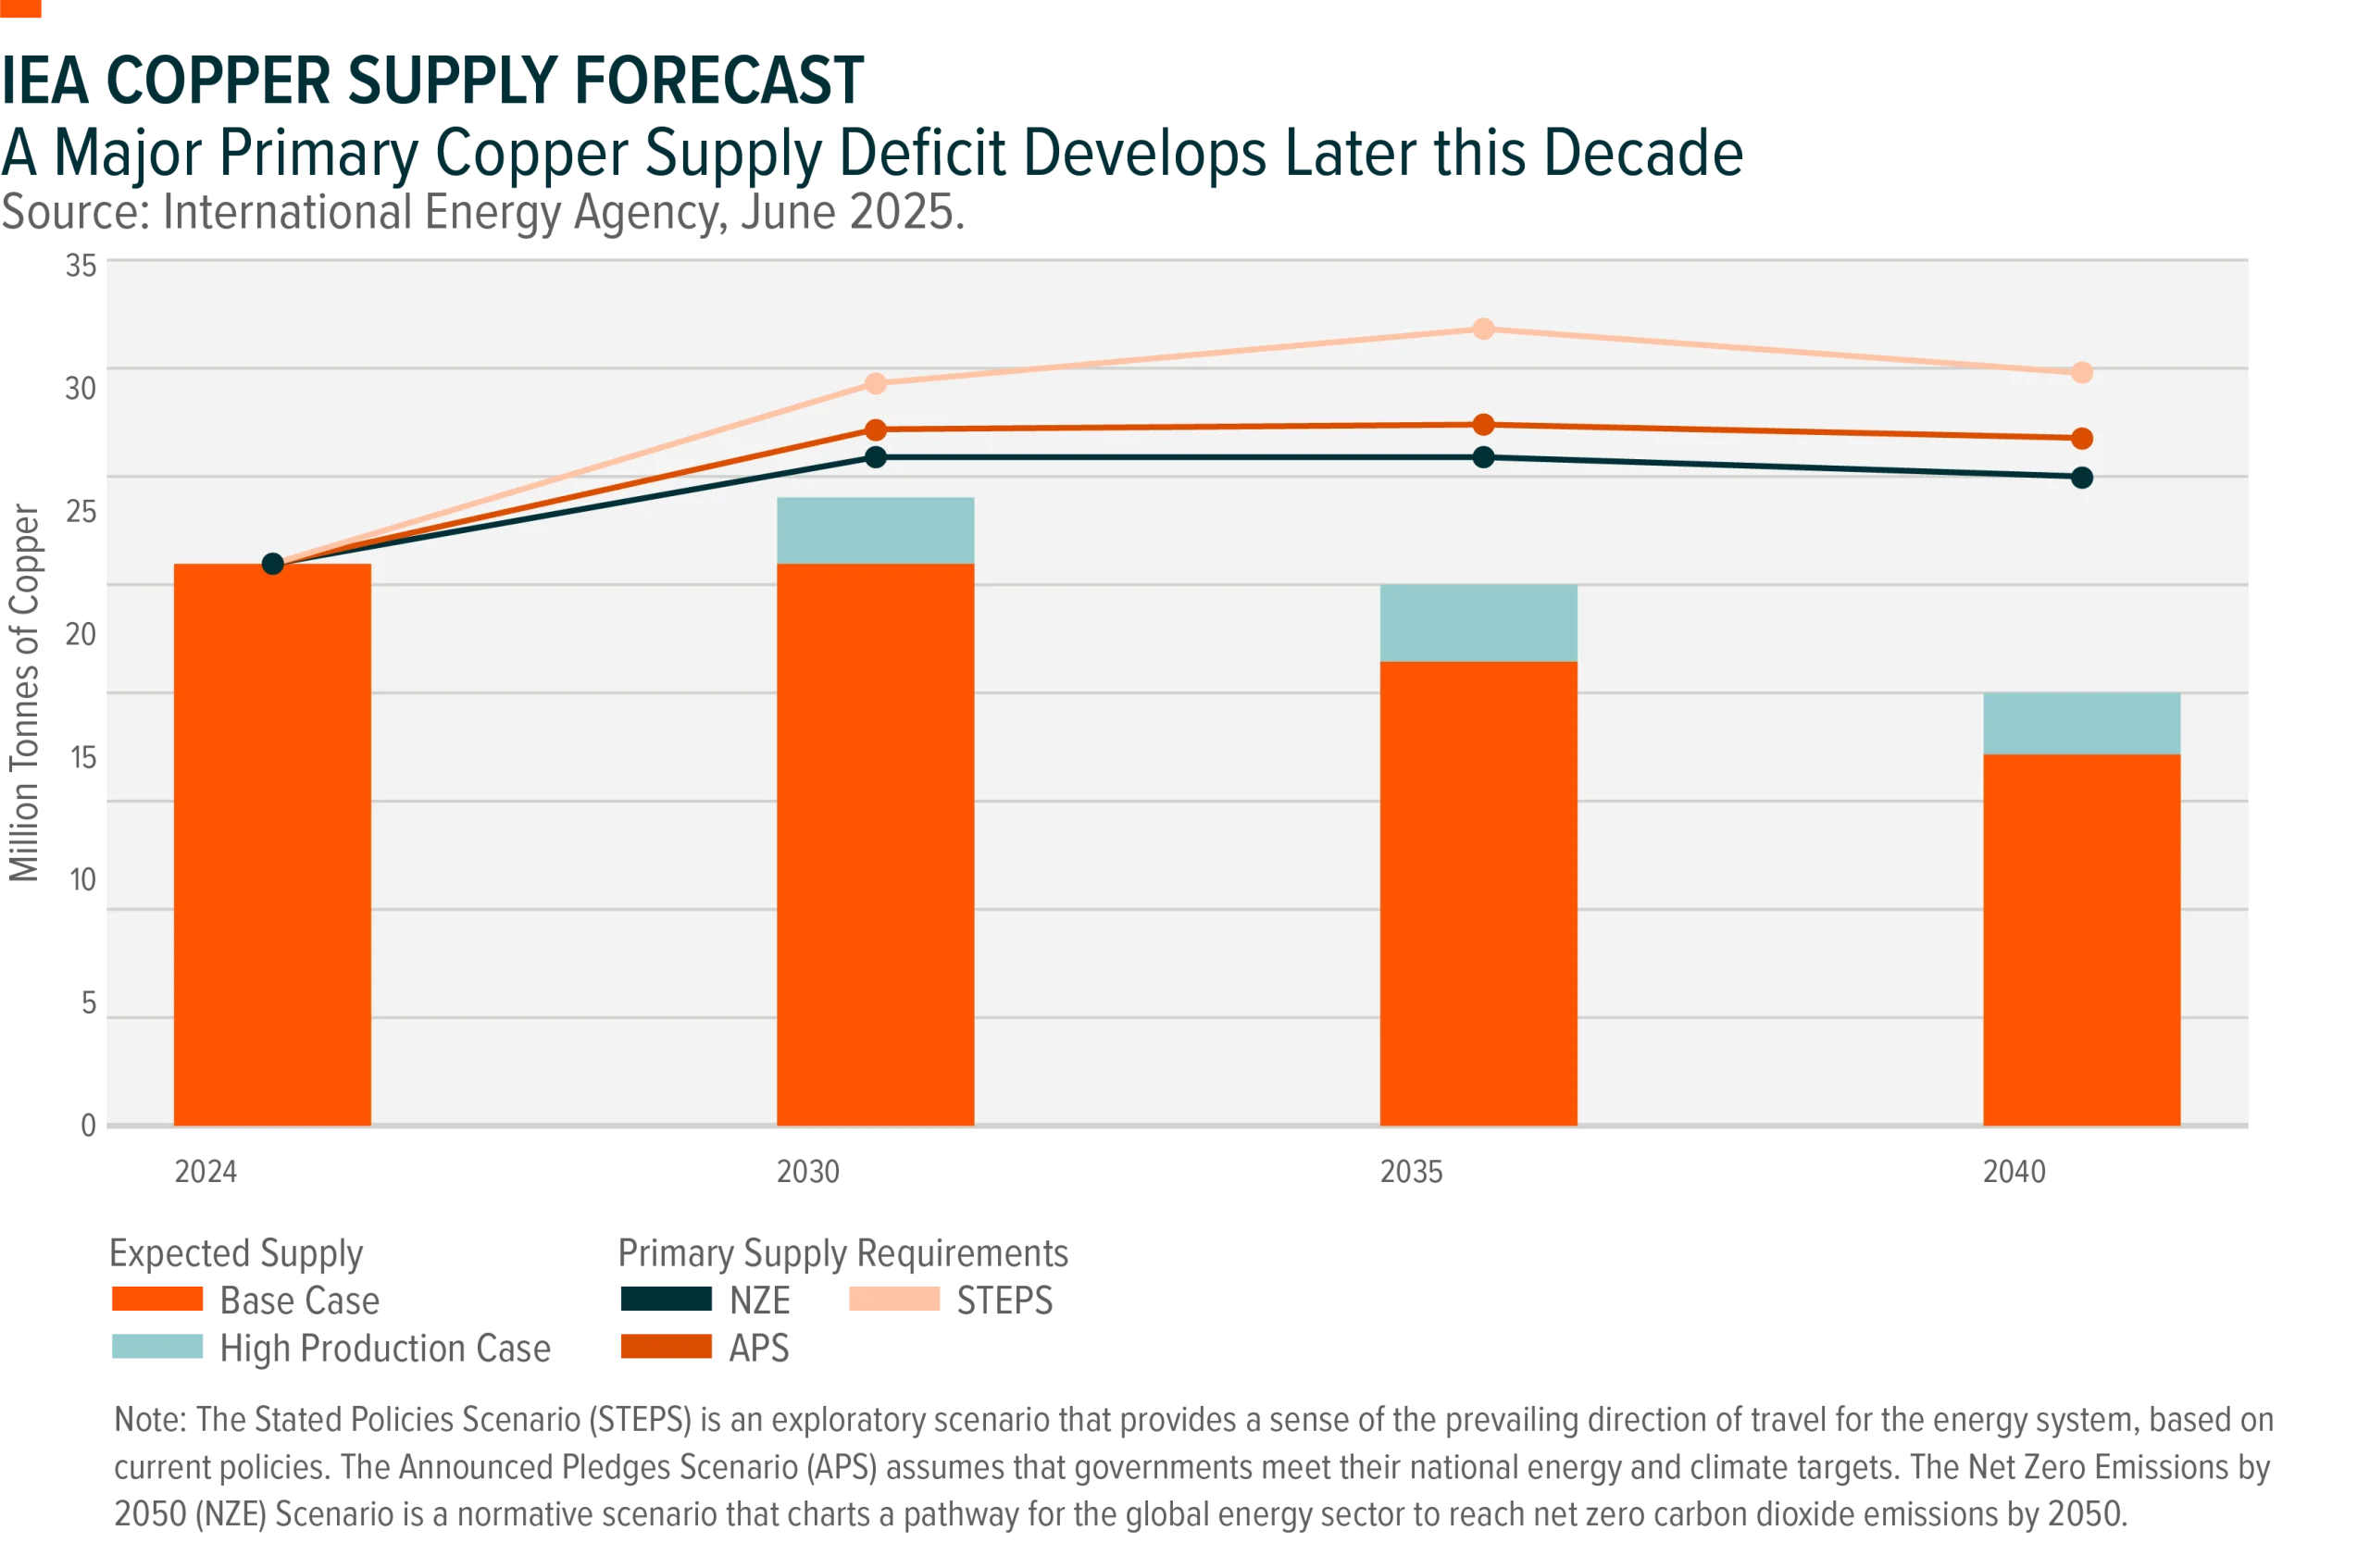
“Some analysts expect copper supply constraints to persist over the coming decade. Investors have not truly priced in the impact of the shortages in the long-term,” Global X’s Thackray adds.
Uranium
Renewed interest in nuclear power comes down to two broad forces: energy security and rising electricity demand:
- Energy security has moved back up the political agenda, and nuclear power offers a source of low-emissions electricity that can support a more secure and diversified energy mix.
- AI-driven infrastructure growth is adding to expectations that power demand could remain elevated for decades.
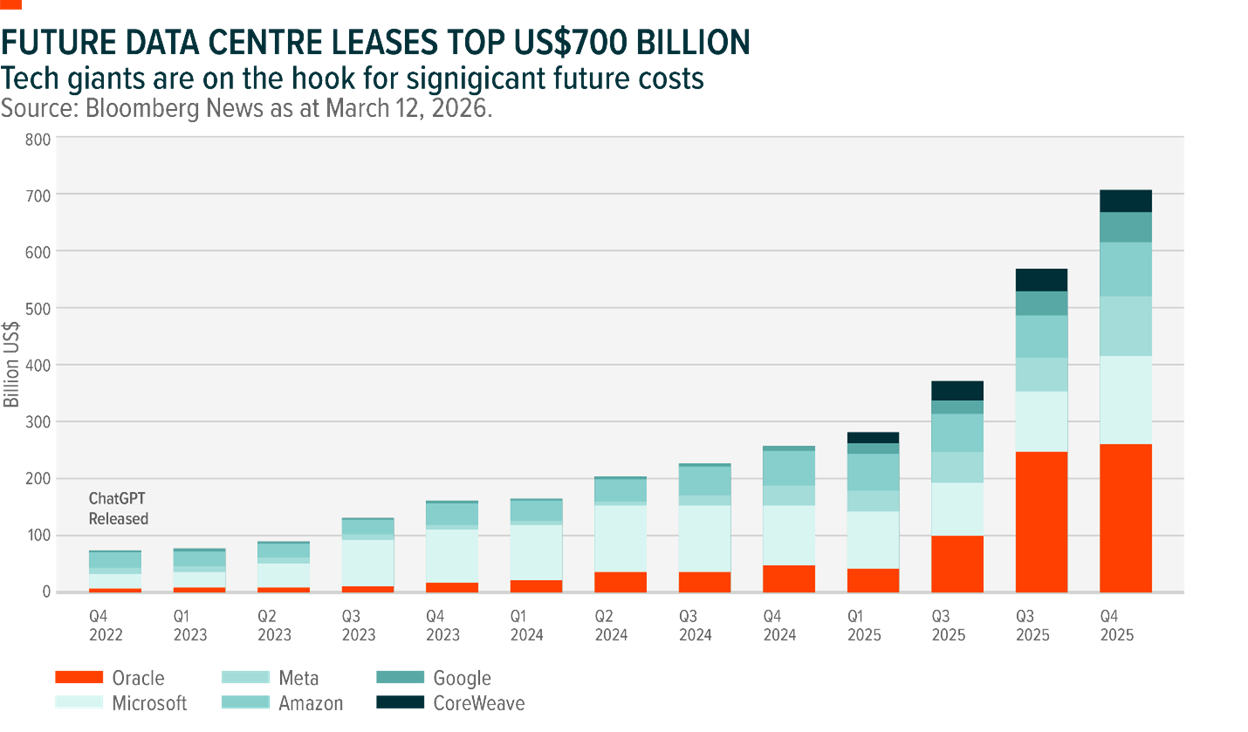
Moody’s Ratings estimates that at least US$3 trillion will flow into data centre-related investments over the next five years. Major U.S. technology firms, including Microsoft, Amazon, Alphabet, Oracle, Meta Platforms and CoreWeave invested U$700 billion on data centres in the fourth quarter of 2025.
The slump in uranium market prices from 2011 to 2021, coupled with uncertainty around nuclear power development in some countries, led to reduced uranium demand, depressed prices, and a slowdown in mine production and development.
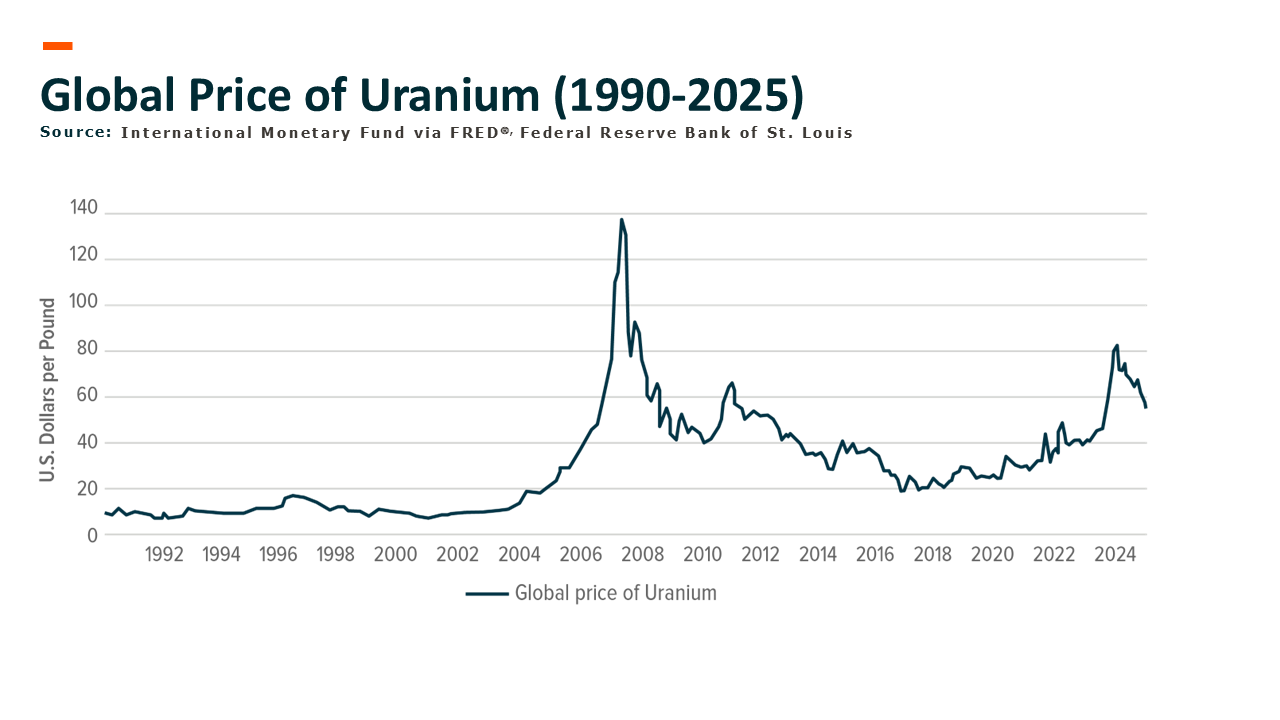
“The problem with the decline of uranium prices is that it made uranium mining companies pull back on expansion plans. Prices can correct higher in the short-term, as they have done recently, but planning and building a greenfield uranium mine can take ten to fifteen years,” Global X’s Thackray says.
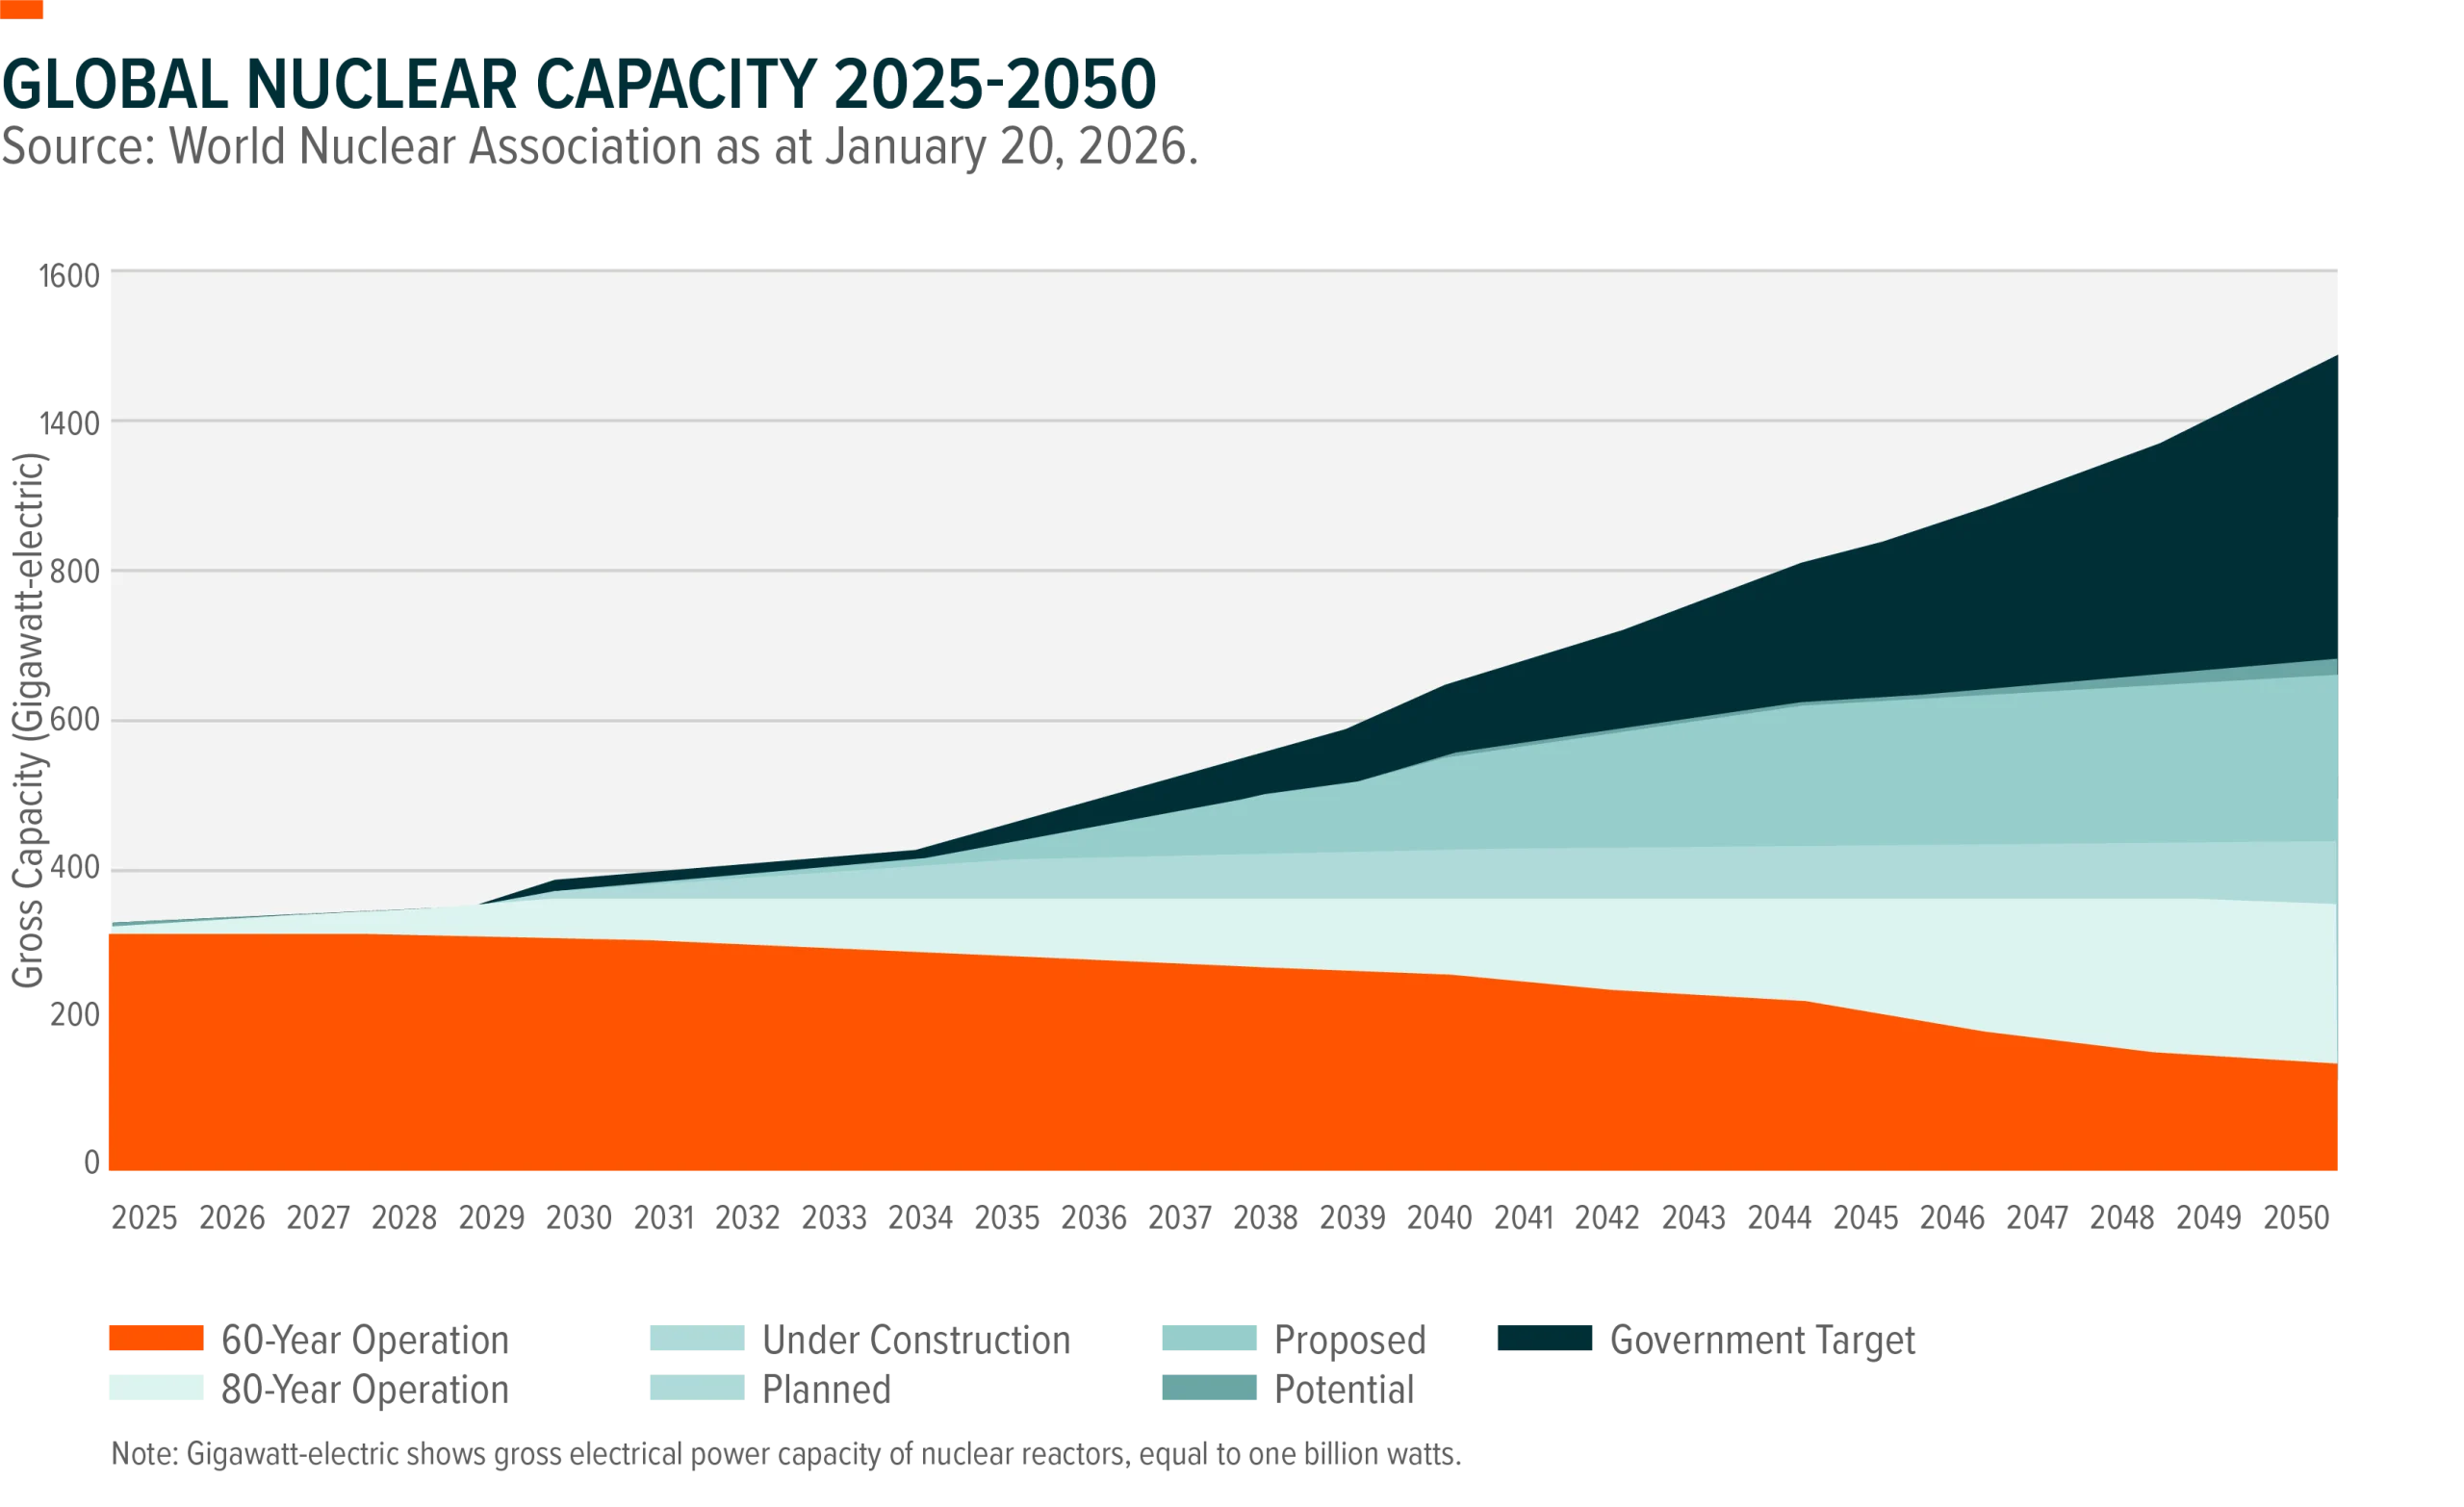
Global nuclear power output reached a record in 2025 and is expected to continue rising through 2050. More than 40 countries now include nuclear energy in their strategies. More than 70 gigawatts of new nuclear capacity are under construction — one of the highest levels in 30 years.
“As AI has ramped up over the last few years, demand for electricity has also ramped up, putting greater strain on the electrical grid. Nuclear power is being seen as a significant base load provider of electricity in the future to power AI.“
Oil
Coordinated U.S.-Israel strikes on Iran in late February 2026 triggered an immediate market response, lifting crude, European natural gas, gold, the U.S. dollar, and Treasuries. The price of West Texas Intermediate crude surged to over US$100 a barrel — levels not seen since 2022 — driven by fears of shipping disruptions in the strategic Strait of Hormuz. European natural gas futures hit three-year highs, with implied volatility rising fourfold since the start of the year.
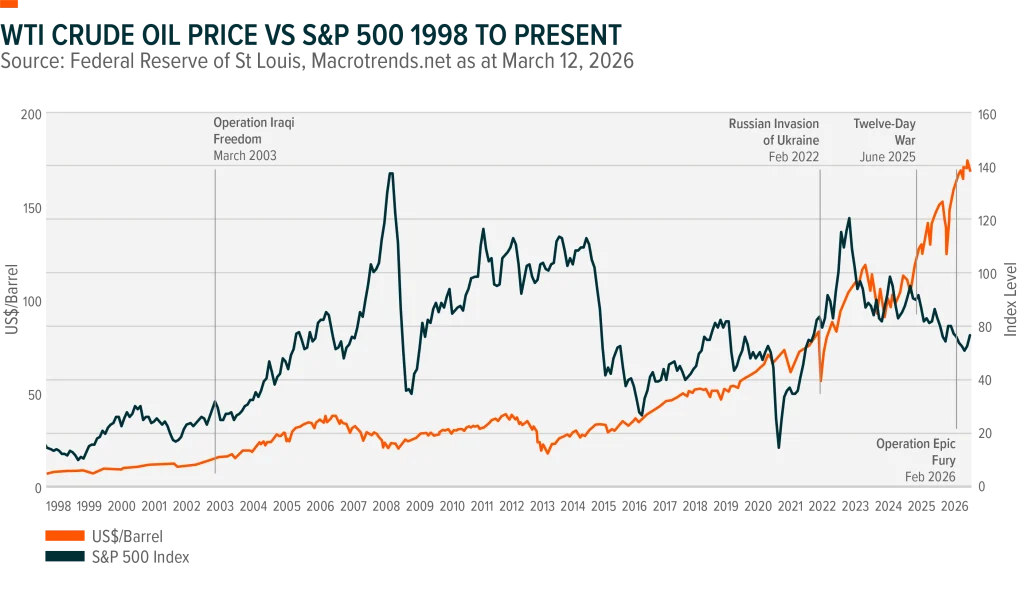
The closure of the Strait has disrupted approximately a fifth of the world’s oil and liquefied natural gas supplies. Experts estimate that crude supplies have been slashed by approximately 13 million barrels11 and the World Bank forecasts that energy prices are expected to surge by 24%12in 2026, which is the highest level since Russia’s invasion of Ukraine in 2022. Prices could rise even further if hostilities in the region escalate and supply disruptions last longer than expected.
The conflict reinforces how quickly geopolitical escalation can reprice risk across commodities, currencies, and defensive assets. And how closely energy security, foreign policy, and economic stability remain interconnected.
“The global demand for oil continues to grow, despite a long and slow transition to green energy,” Global X’s Thackray says.
“There has been a lack of investment in the energy complex, leaving the potential for large shortages in the future. The recent U.S./Israel Iran war has highlighted the fragility of the energy production and distribution network. Energy markets may remain sensitive to geopolitical developments and supply disruptions.”
Natural Gas
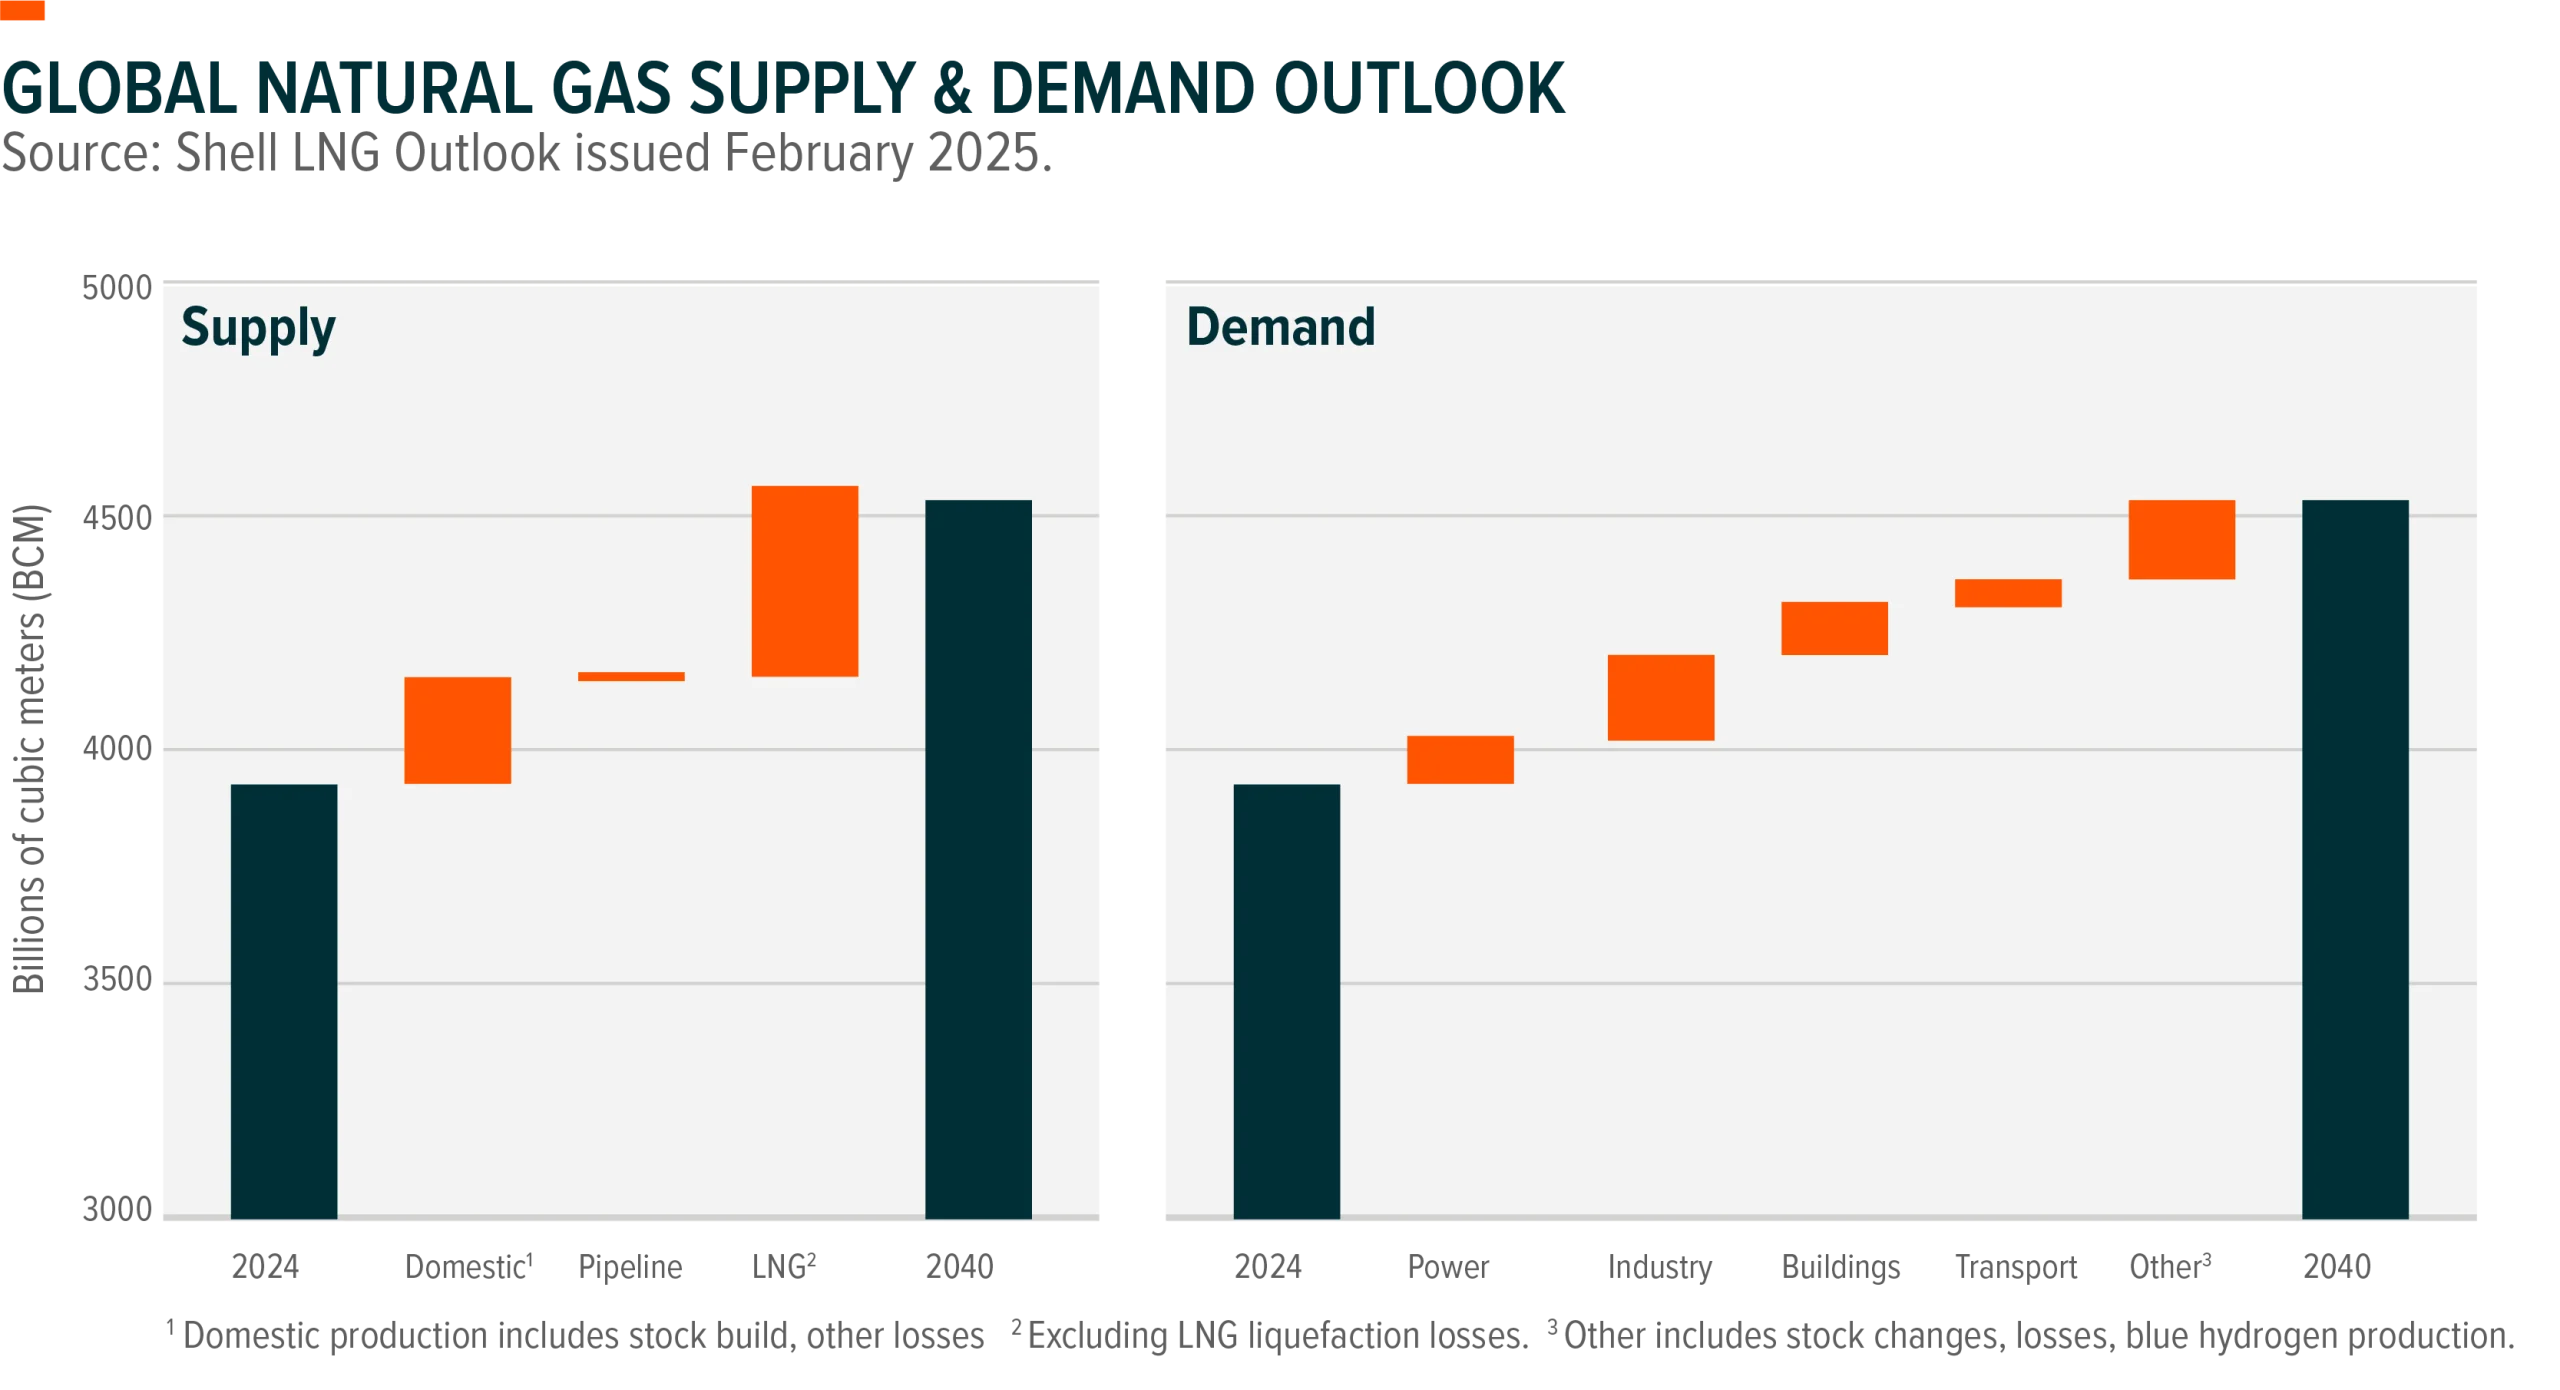
Natural gas has gained importance in power generation, as electricity demand continues to rise. Worldwide demand for natural gas is expected to rise in the coming decade, with current forecasts calling for total U.S. natural gas consumption to rise by as much as 25 billion cubic feet per day by 2030 – an almost 27% increase from 2024.13
Key drivers of demand growth include growing exports, rising power consumption, and budding energy themes like electrification and AI data center expansions.
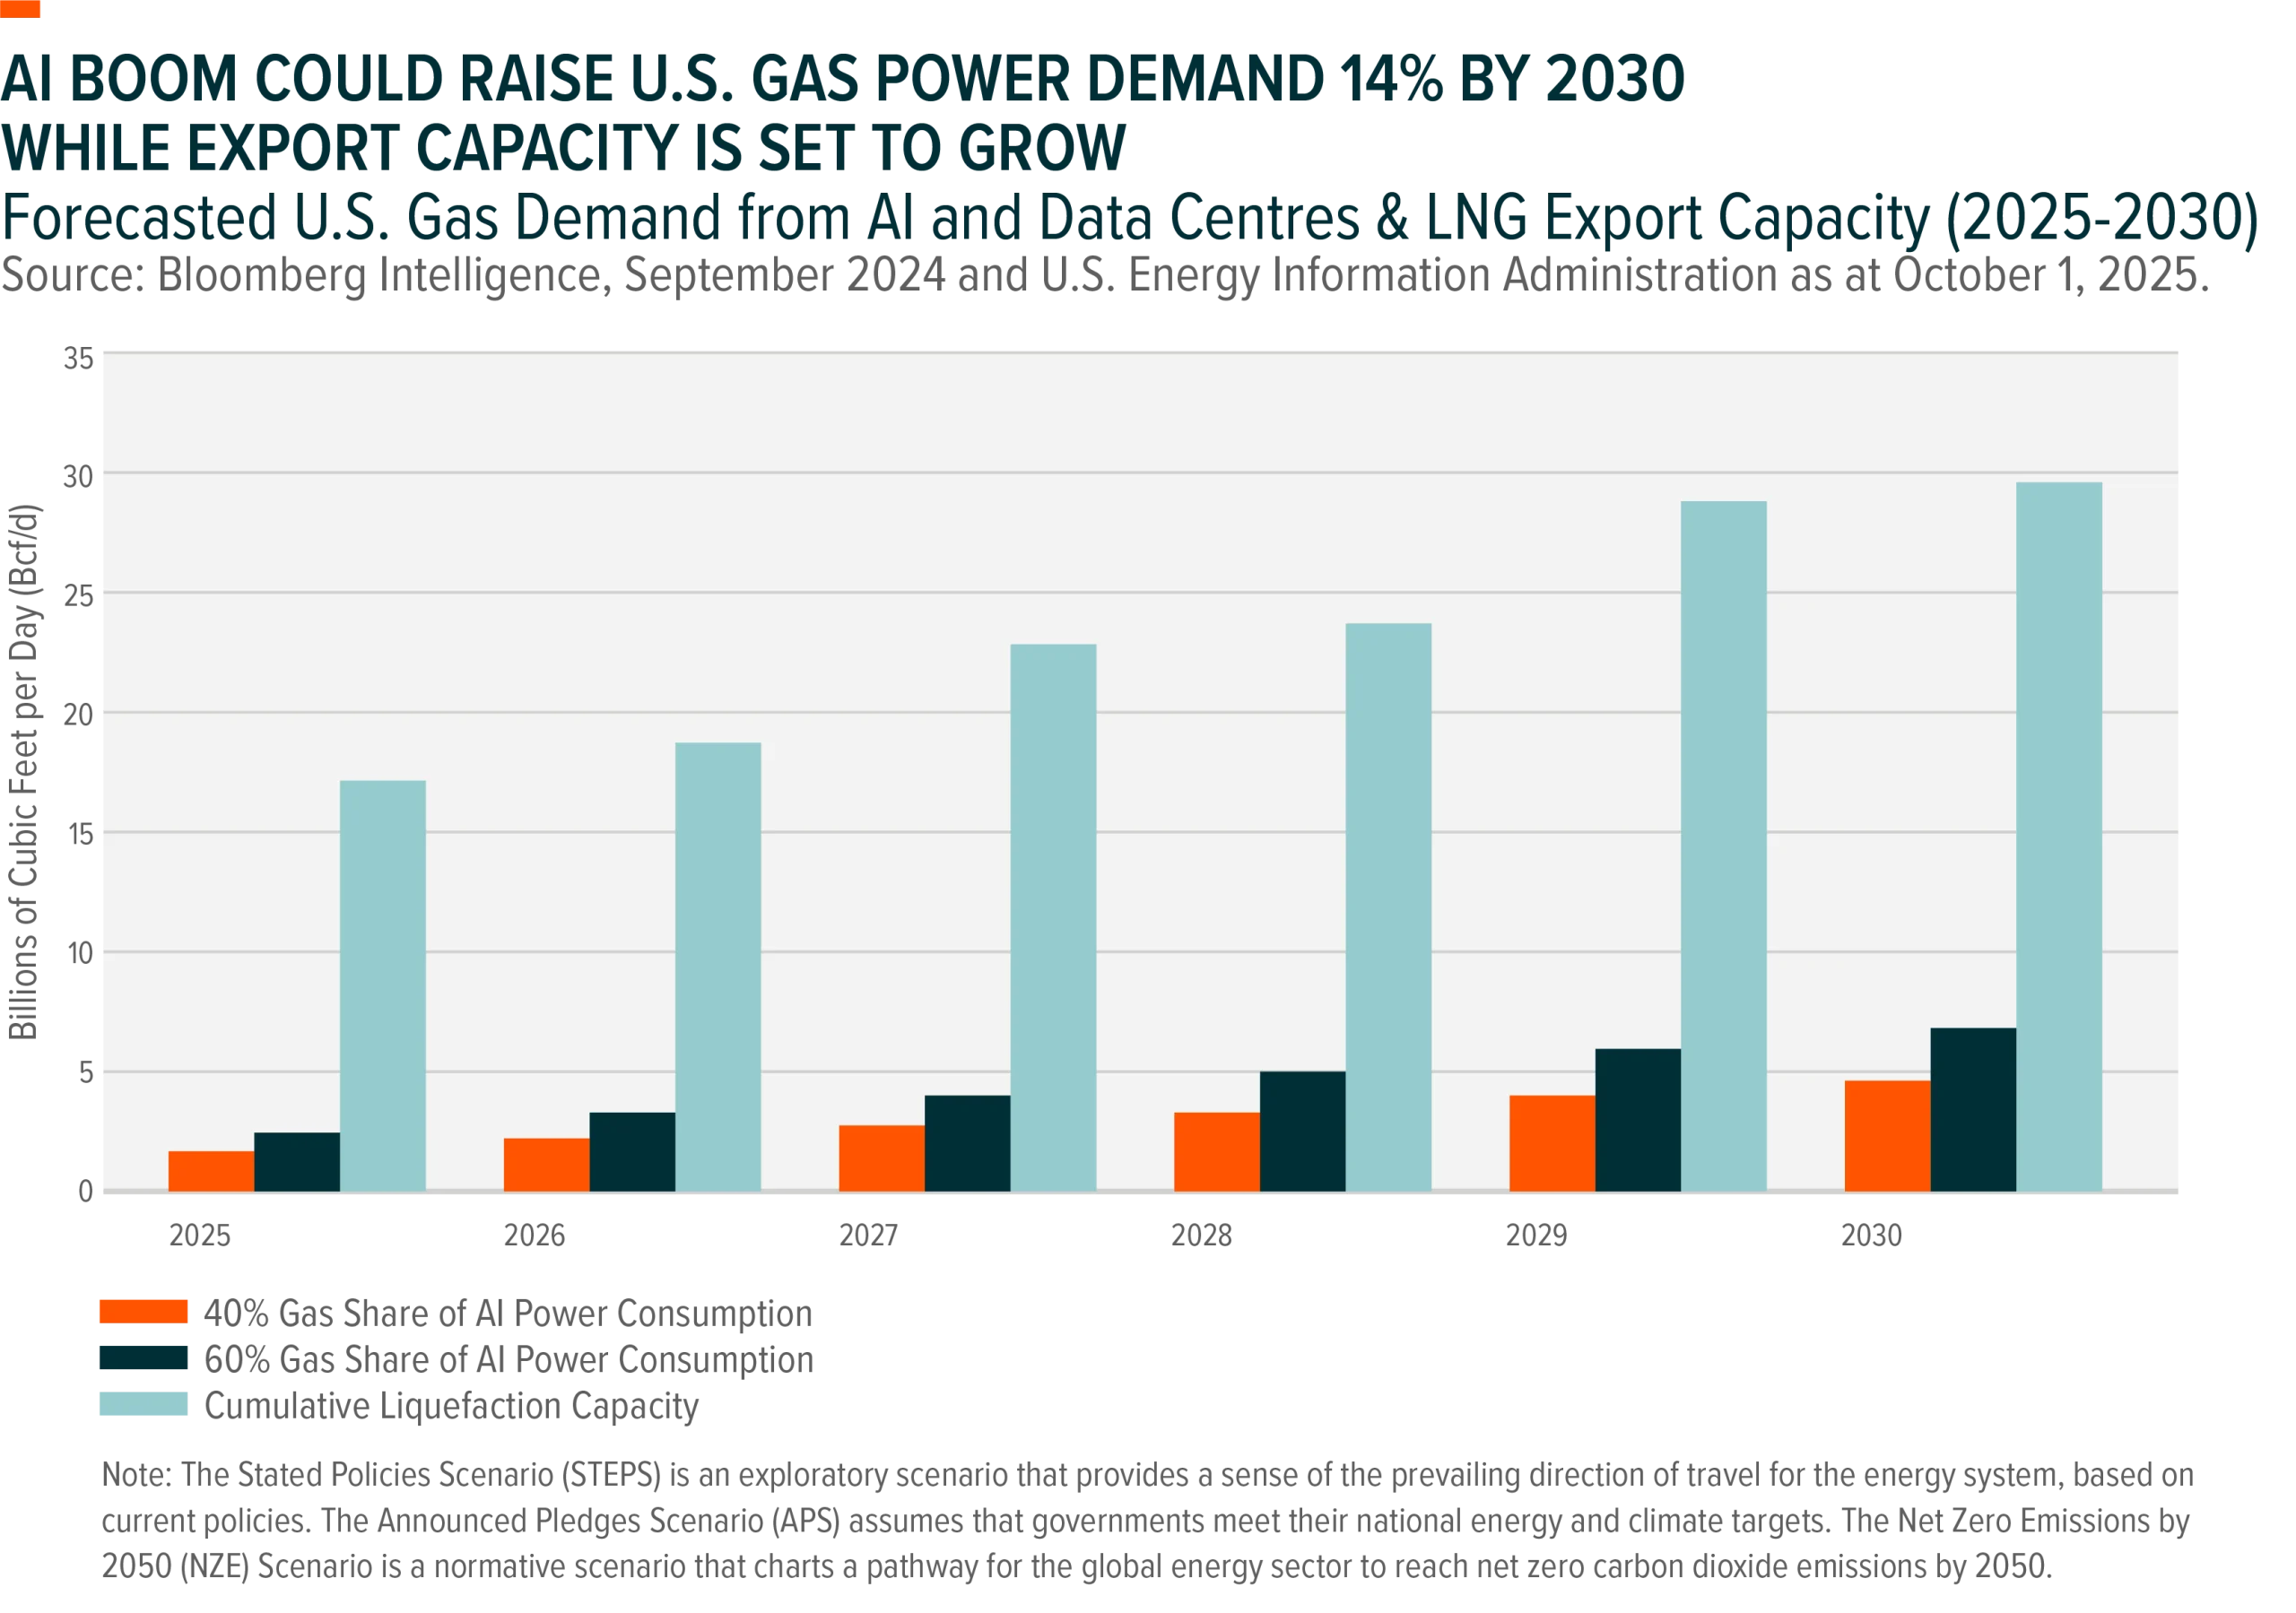
Data centers and energy exports have been meaningfully influential drivers of demand. At present, nearly 40% of data center power load is being fueled by natural gas.14
If gas plant deployments persist and natural gas gains a greater share in AI power demand, Bloomberg Intelligence15 projects gas power consumption from AI and data centers could rise to as much as 6.8 billion cubic feet per day by 2030, which could boost total U.S. gas-powered consumption by nearly 14%.
Meanwhile, global natural gas demand rose by 78 billion cubic meters in 2024 and is expected to see similar growth in 2025.16
Lithium
With the world transitioning to a low-carbon economy, rechargeable batteries are in high demand – especially as many countries will begin to phase out the sale of new gasoline fuel vehicles over the coming years in favour of electric vehicles (EVs). Demand for electric vehicle batteries uses approximately 75% of the global lithium supply.17
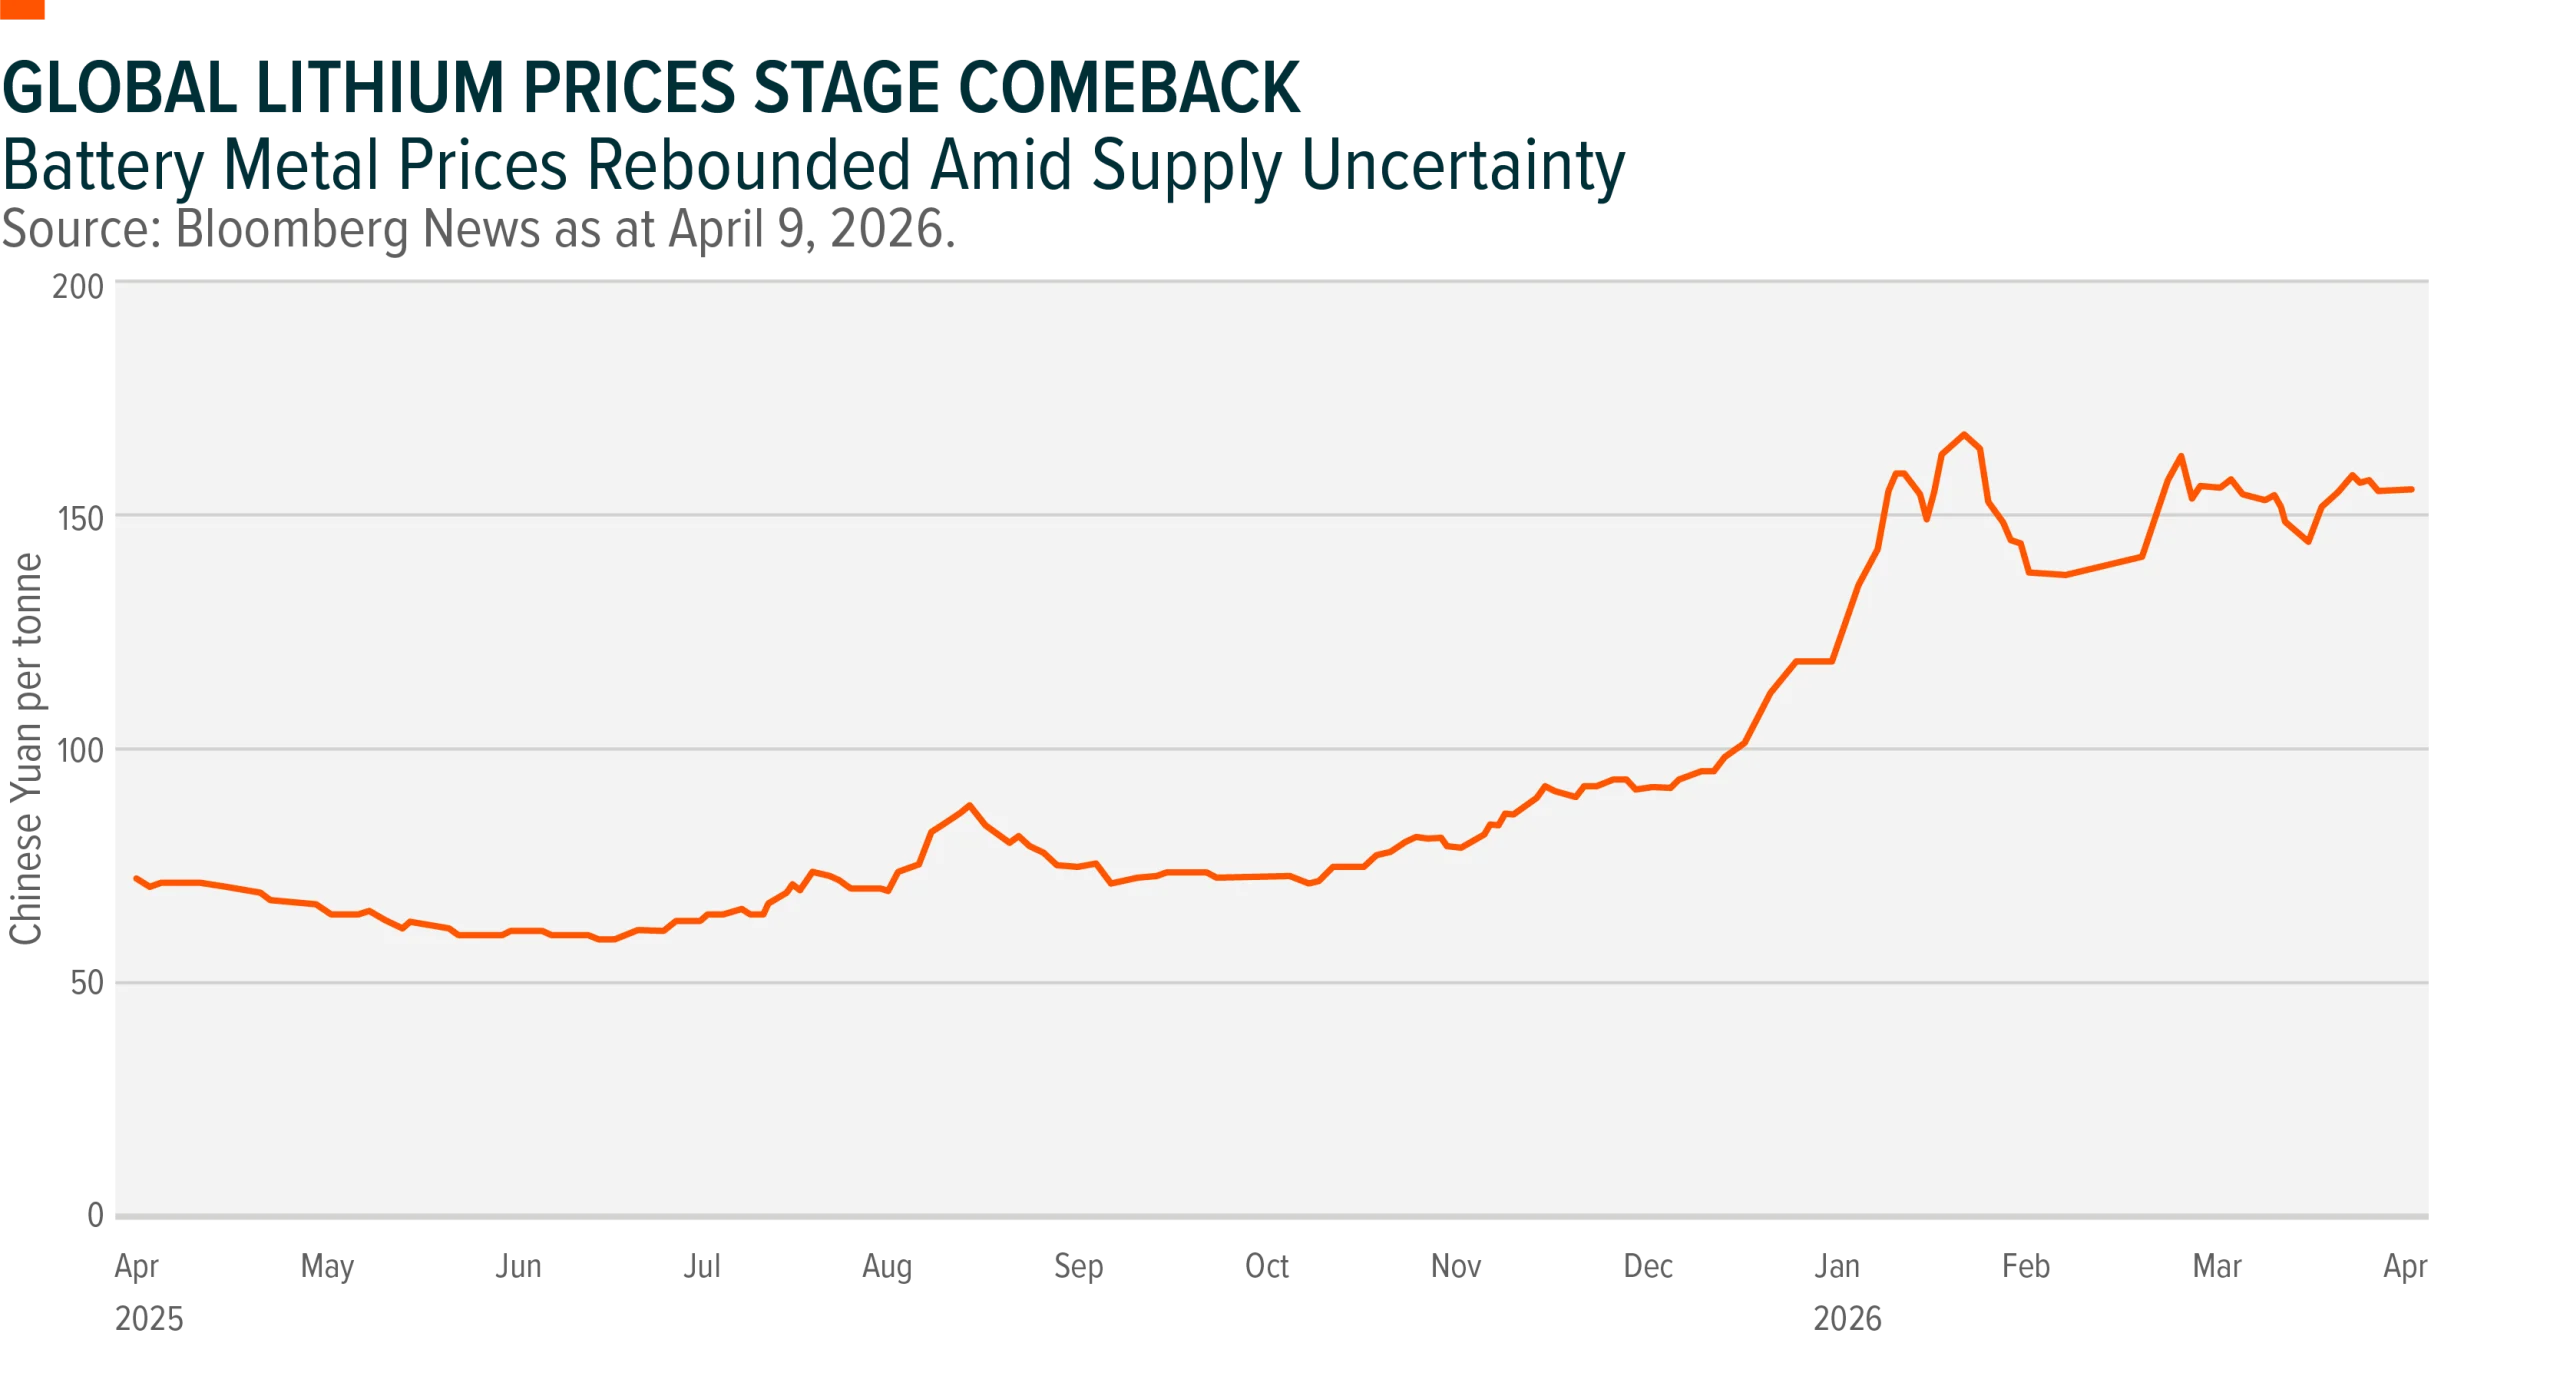
Canaccord Genuity expects the global lithium market to shift into a material deficit from 2026,18 with tight supply, export restrictions and weak mine investment This deficit, Canaccord says, could last until 2035. Even if rising lithium prices through 2027-28 could ignite a supply response, that would still fall short of demand growth forecasts.
In the early months of 2026, lithium prices have soared on persistent worries over supply, led by the suspension of a key mine in China and Zimbabwe’s introduction of a ban on raw lithium exports.
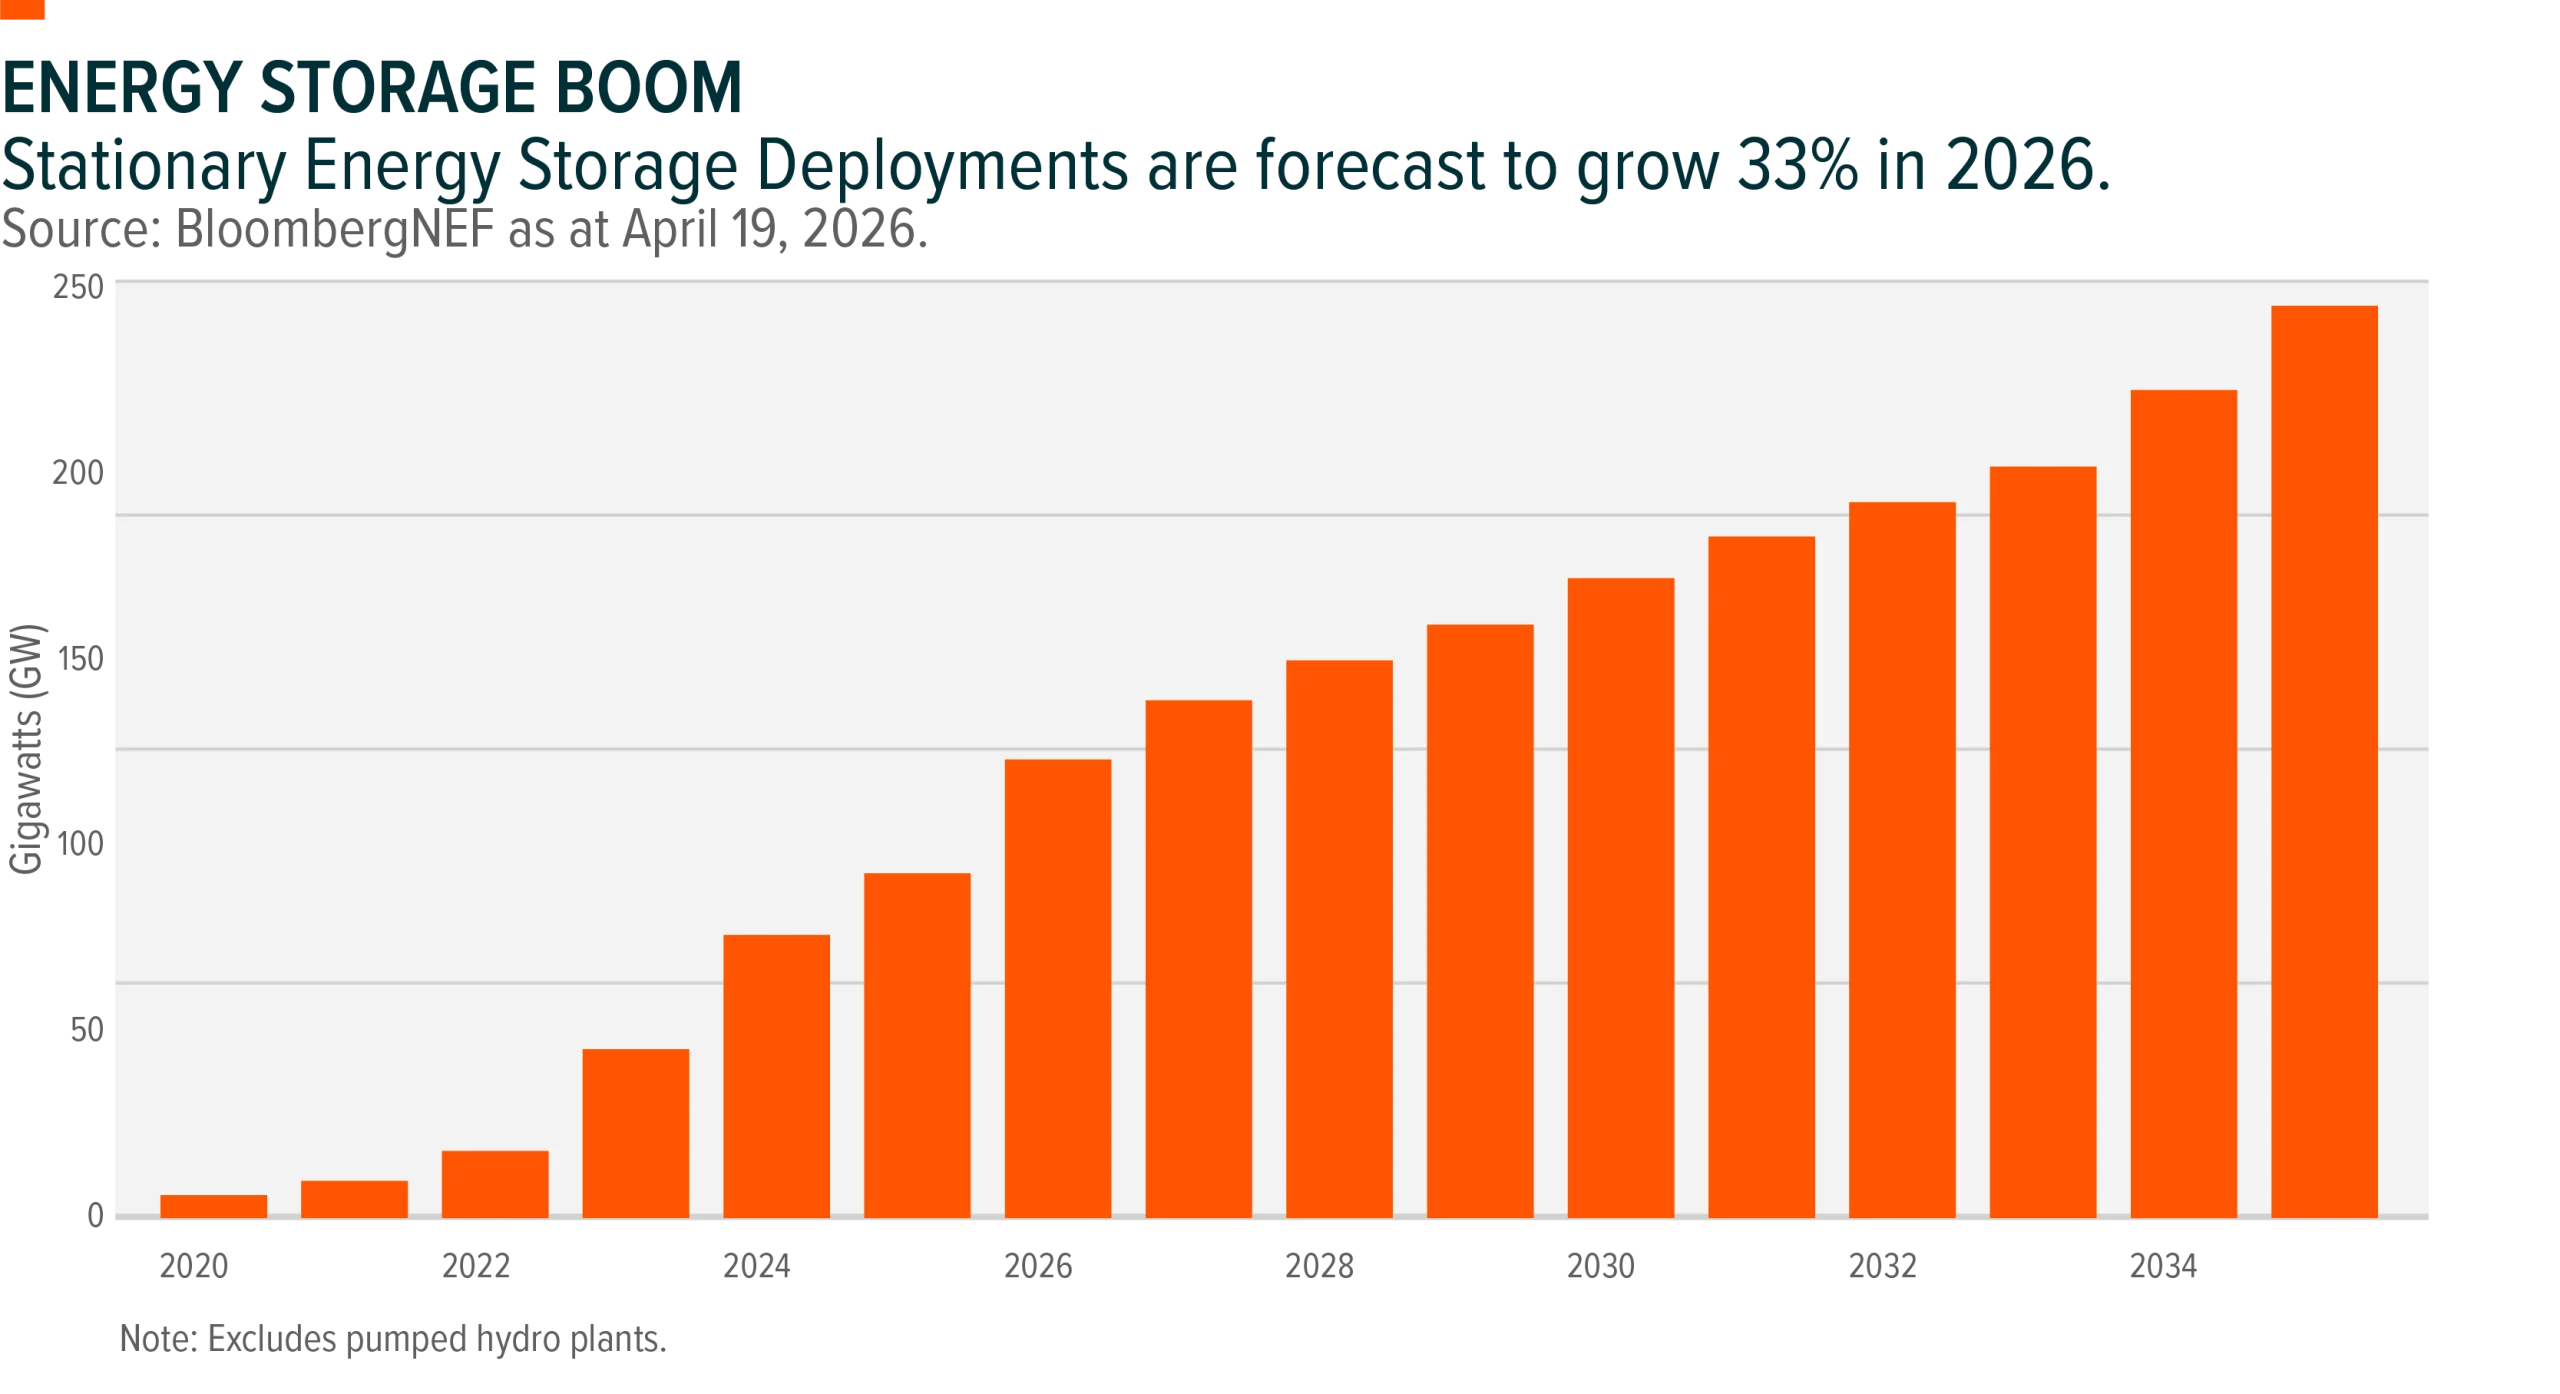
But it’s not just batteries for electric vehicles. Falling battery costs and soaring energy demand have already set the stage for the rapid growth of electric batteries as storage for energy utilities around the world.
The war in the Middle East has helped accelerate the trend by lifting demand for alternatives to expensive fossil fuels, contributing to increased attention on battery storage technologies.
Analysts at Bloomberg expect battery installations to jump by about one third in 202619, led by expansion in Europe, the Middle East, Africa and Latin America.
Bottom Line
Commodities are the raw materials behind everyday products. Low correlation to stocks and bonds means they react differently to economic conditions, helping reduce overall portfolio volatility. They also tend to benefit from rising inflation, making them a potential hedge when prices accelerate, a characteristic few other asset classes can offer.
Recent market developments have renewed investor interest in commodity-related investments. Gold has historically been viewed by some investors as a defensive asset during periods of market volatility; silver’s industrial demand base is expanding alongside the energy transition; copper sits at the intersection of electrification and AI; uranium is benefiting from a structural nuclear revival. And geopolitical disruption to oil supply continues to highlight the strategic importance of energy security. COMX, CMCC and CMCL offer Canadian investors a single, diversified solution to access this opportunity across the full commodity value chain.
Related ETFs
Global X All-In-One Commodity Producers Equity ETF (COMX)
Global X All-In-One Commodity Producers Equity Covered Call ETF (CMCC)
Global X Enhanced All-In-One Commodity Producers Equity Covered Call ETF (CMCL)
Visit our Precious Metals and Commodities pages for our full suite of ETFs.
Sources
1 Source: CBS News as at February 2, 2026: Trump announces $12 billion U.S. stockpile of rare earth minerals.
2 Source: Reuters as at April 7, 2026.
3 Source: The Silver Institute as at April 15, 2026: Elevated Lease Rates, Regional Liquidity Tightness, and Robust Investor Interest Resulted in Record Silver Prices in 2025.
4 Source: World Gold Council as at January 29, 2026
5 Source: Bloomberg News as at April 15, 2026: Silver Market Poised for Sixth Straight Annual Deficit This Year.
6 Source: Bloomberg News as at April 20, 2026: China’s Silver Imports Jump to Record on Retail and Solar Demand.
7 Source: Silver Institute as at February 10, 2026: Global Silver Investment to Remain Strong in 2026 Against the Backdrop of a Sixth Consecutive Annual Market Deficit.
8 Source: Bloomberg News as at April 21, 2026: Supply Crunch Threatens U.S. Need for 106 Gigawatts of New Power.
9 Source: International Copper Association.
10 Ibid.
11 Source: Reuters as at April 22,2026: Iran war may crush oil demand today, but send it soaring long term.
12 Source: Reuters as at April 28, 2026: World Bank forecasts 24% surge in energy prices in 2026 due to Middle East w
13 Source: Argus Media as at August 19, 2025.
14 Source: Natural Gas Intelligence as at April 2025.
15 Source: Bloomberg News as at April 21, 2026: Supply Crunch Threatens US Need for 106 Gigawatts of New Power.
16 Source: World Economic Forum as at September 17, 2025.
17 Source: Investors Business Daily as at April 16, 2026: Mining Stock Albemarle Breaks Out Amid Surging Lithium Prices.
18 Source: Mining.com as at April 22, 2026: Lithium market to enter deficit until 2035, says Canaccord.
19 Source: Bloomberg News as at April 19, 2026: Cheap Batteries Are Taking Over the World’s Power Grids.
DISCLAIMERS
Commissions, management fees, and expenses all may be associated with an investment in products (the “Global X Funds”) managed by Global X Investments Canada Inc. The Global X Funds are not guaranteed, their values change frequently and past performance may not be repeated. Certain Global X Funds may have exposure to leveraged investment techniques that magnify gains and losses which may result in greater volatility in value and could be subject to aggressive investment risk and price volatility risk. Such risks are described in the prospectus. The prospectus contains important detailed information about the Global X Funds. Please read the relevant prospectus before investing.
Certain ETFs are alternative investment funds (“Alternative ETFs”) within the meaning of the National Instrument 81-102 Investment Funds (“NI 81-102”) and are permitted to use strategies generally prohibited by conventional mutual funds, such as the ability to invest more than 10% of their net asset value in securities of a single issuer, the ability to borrow cash, to short sell beyond the limits prescribed for conventional mutual funds and to employ leverage of up to 300% of net asset value. While these strategies will only be used in accordance with the investment objectives and strategies of the Alternative ETFs, during certain market conditions they may accelerate the risk that an investment in ETF Shares of such Alternative ETF decreases in value. The Alternative ETFs will comply with all requirements of NI 81-102, as such requirements may be modified by exemptive relief obtained on behalf of the ETF.
SLVX (the “Solactive Index ETF”) is not sponsored, promoted, sold or supported in any other manner by Solactive nor does Solactive offer any express or implicit guarantee or assurance either with regard to the results of using the applicable Underlying Index and/or its trade mark or prices at any time or in any other respect. The Underlying Index is calculated and published by Solactive. Solactive uses its best efforts to ensure that the Underlying Index is calculated correctly. Irrespective of its obligations towards the Solactive Index ETF or the Manager, Solactive has no obligation to point out errors in these Underlying Index to third parties including but not limited to investors and/or financial intermediaries of the Solactive Index ETF. Neither publication of the Underlying Index by Solactive nor the licensing of the Underlying Index or its trade mark for the purpose of use in connection with the Solactive Index ETF constitutes a recommendation by Solactive to invest capital in the Solactive Index ETF nor does it in any way represent an assurance or opinion of Solactive with regard to any investment in the Solactive Index ETF.
Certain statements may constitute a forward-looking statement, including those identified by the expression “expect” and similar expressions (including grammatical variations thereof). The forward-looking statements are not historical facts but reflect the author’s current expectations regarding future results or events. These forward-looking statements are subject to a number of risks and uncertainties that could cause actual results or events to differ materially from current expectations. These and other factors should be considered carefully and readers should not place undue reliance on such forward-looking statements. These forward-looking statements are made as of the date hereof and the authors do not undertake to update any forward-looking statement that is contained herein, whether as a result of new information, future events or otherwise, unless required by applicable law.
This communication is intended for informational purposes only and does not constitute an offer to sell or the solicitation of an offer to purchase investment products (the “Global X Funds”) managed by Global X Investments Canada Inc. and is not, and should not be construed as, investment, tax, legal or accounting advice, and should not be relied upon in that regard. Individuals should seek the advice of professionals, as appropriate, regarding any particular investment. Investors should consult their professional advisors prior to implementing any changes to their investment strategies. These investments may not be suitable to the circumstances of an investor.
All comments, opinions and views expressed are generally based on information available as of the date of publication and should not be considered as advice to purchase or to sell mentioned securities. Before making any investment decision, please consult your investment advisor or advisors.
Global X Investments Canada Inc. (“Global X”) is a wholly owned subsidiary of Mirae Asset Global Investments Co., Ltd. (“Mirae Asset”), the Korea-based asset management entity of Mirae Asset Financial Group. Global X is a corporation existing under the laws of Canada and is the manager, investment manager and trustee of the Global X Funds.
Published May 13, 2026

How Canadian Investors Use Finfluencers to Learn About Investing
Not ready to invest, but curious to learn more?
Subscribe for research perspectives, market commentary, and charts of the trends shaping global markets. We promise not to overwhelm you – updates will be periodic and timely.